Promo code "00LAYOUTS"
8 Segment Cycle Keynote Charts Template for Dynamic Presentations
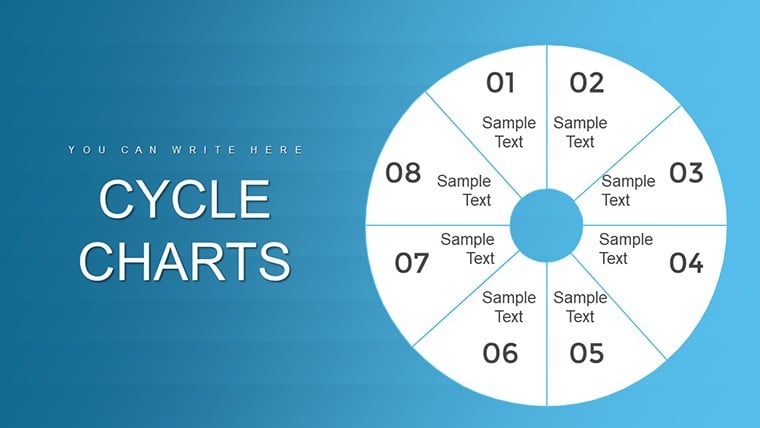
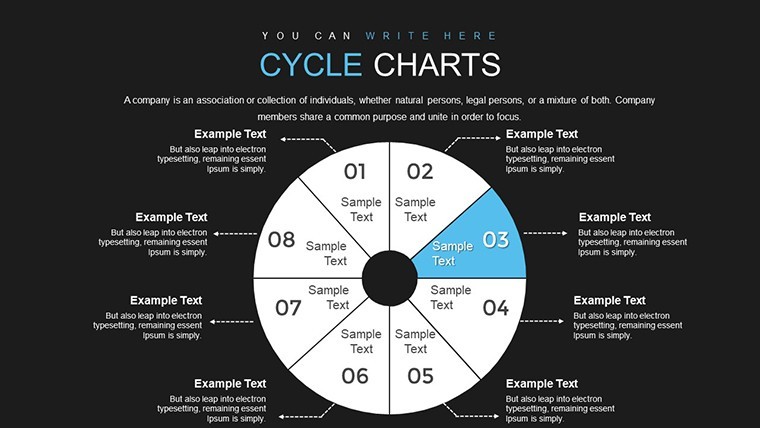
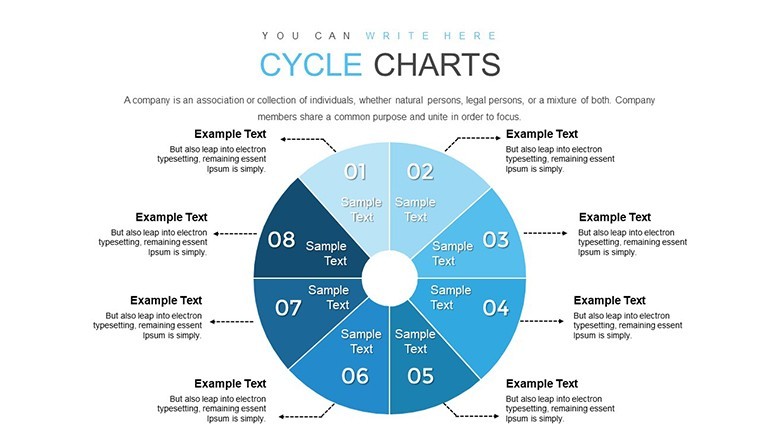
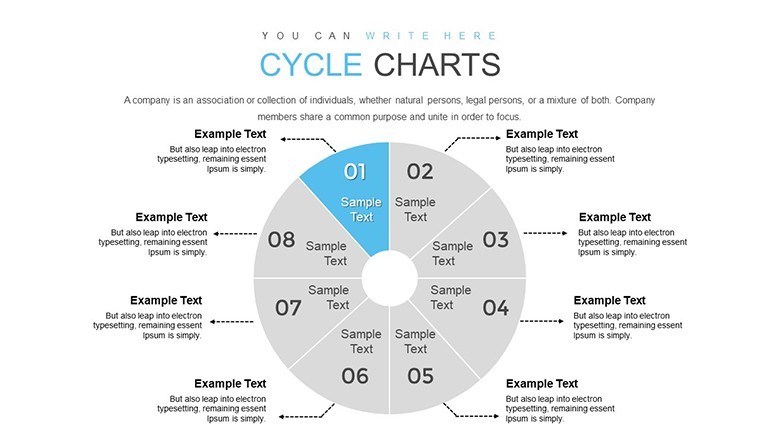
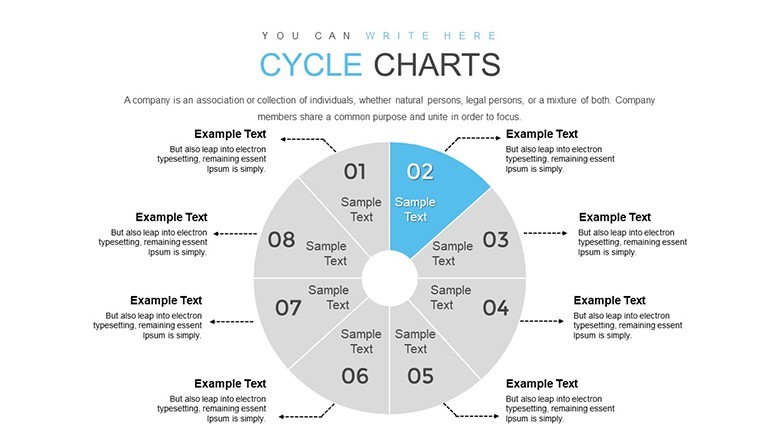
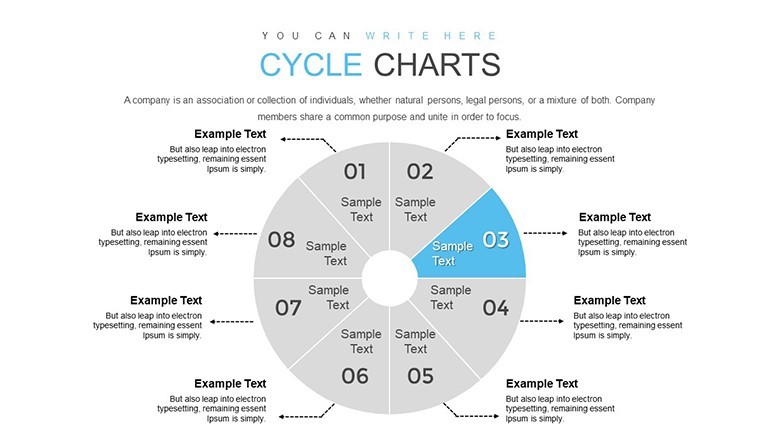
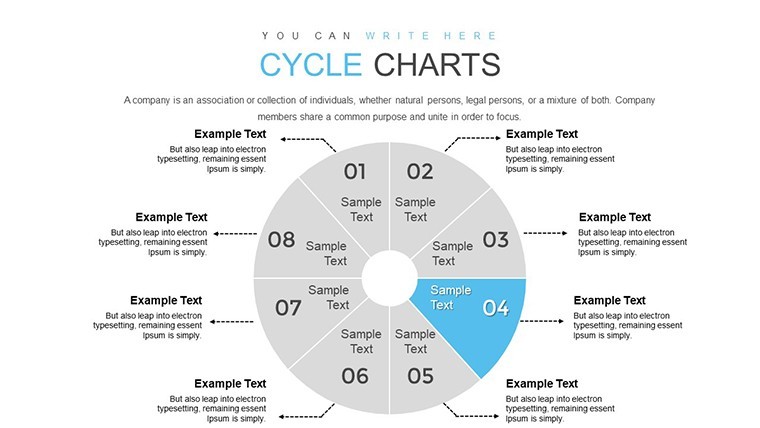
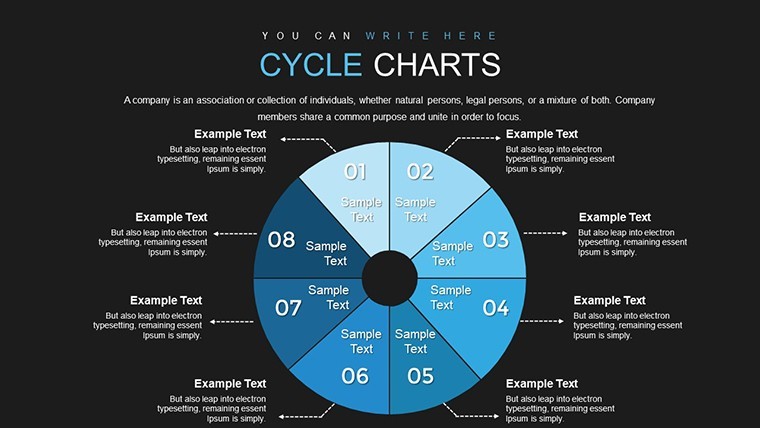
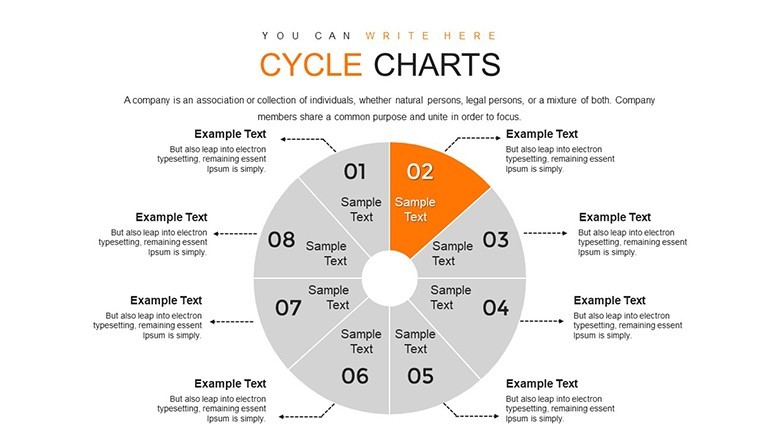
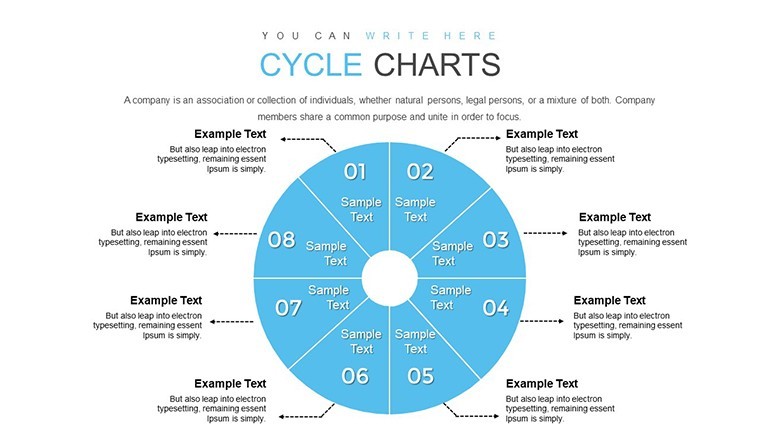
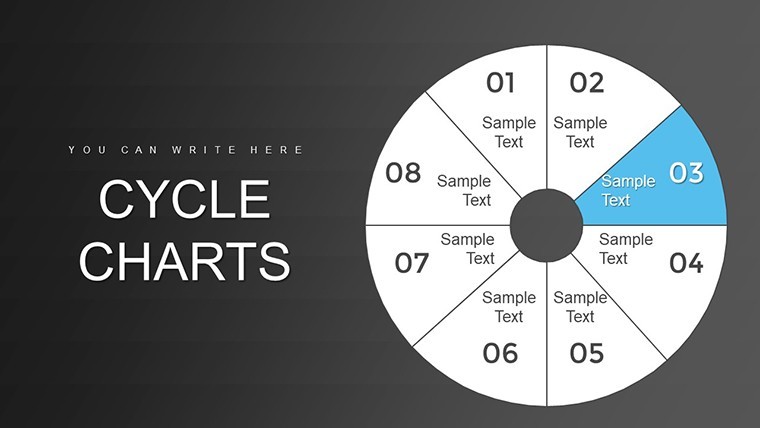
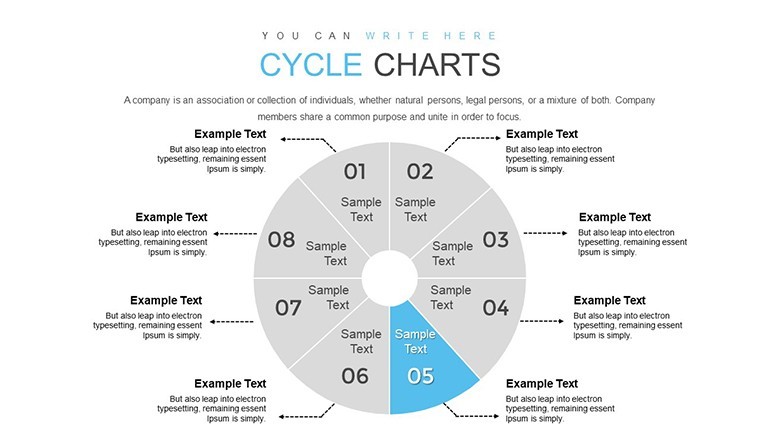
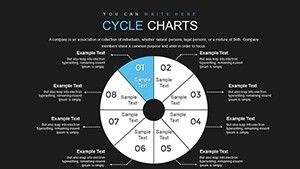
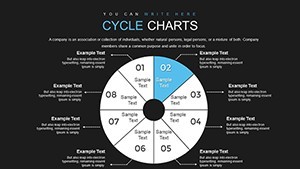
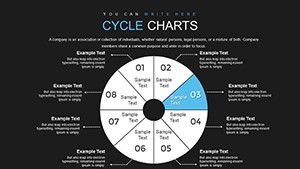
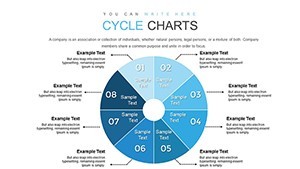
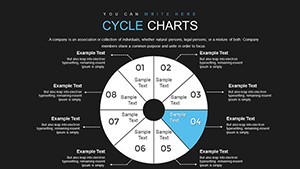
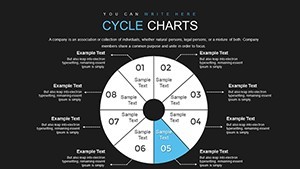
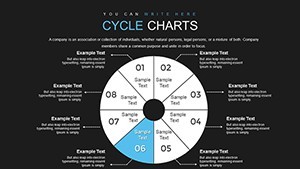
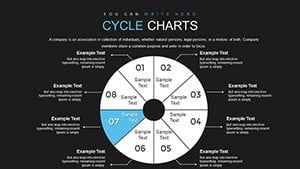
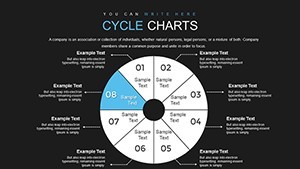
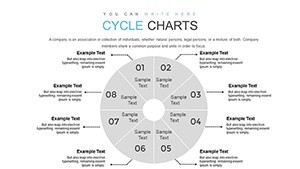
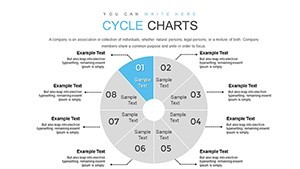
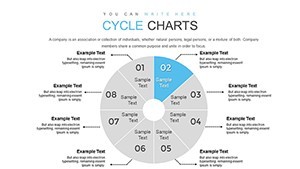
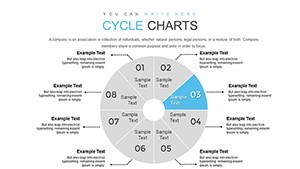
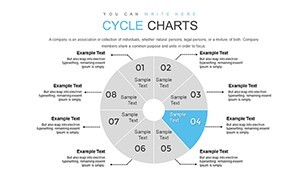
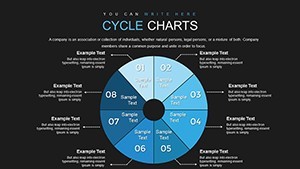
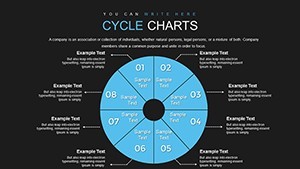
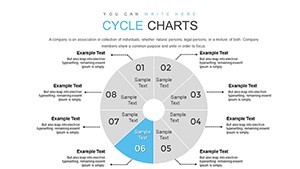
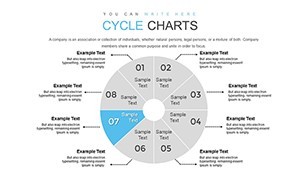
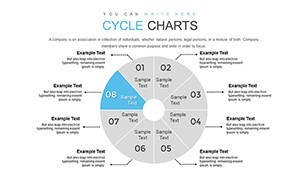
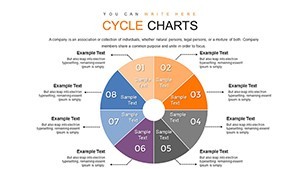
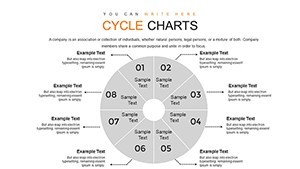
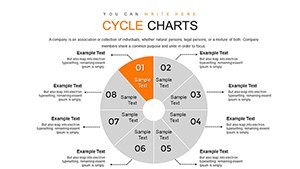
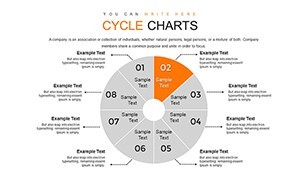
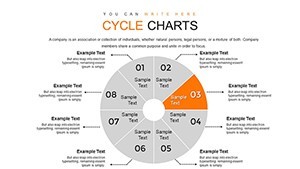
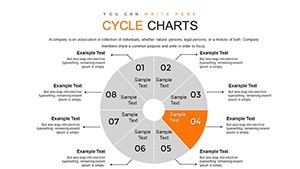
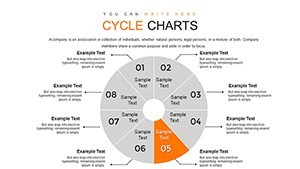
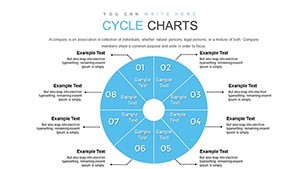
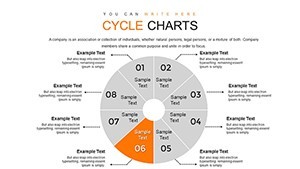
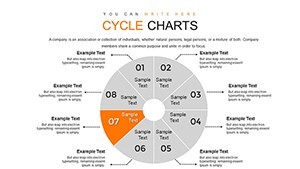
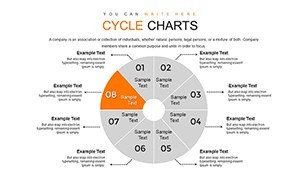
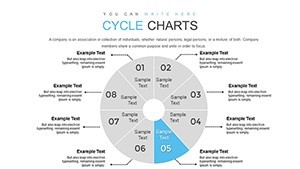
Ever felt like your presentations are stuck in a loop of boredom? Break the cycle with our 8 Segment Cycle Keynote Charts Template, a versatile tool crafted to bring structure and excitement to your ideas. Featuring 34 editable slides, this template specializes in cyclical processes, making it ideal for professionals who need to illustrate ongoing flows like project lifecycles, marketing funnels, or educational concepts. Whether you're a marketer mapping customer journeys or an educator explaining biological cycles, this template turns abstract ideas into tangible, engaging visuals that keep your audience spinning with interest.
Drawing from design principles championed by experts like Edward Tufte, who emphasized clarity in information display, this template ensures your cycles are not just seen but understood. With pie and cycle chart integrations, it's perfect for breaking down complex systems into digestible segments. Users in diverse fields have leveraged similar designs to streamline communications - picture a sales team using it to depict the sales pipeline, resulting in clearer strategies and improved close rates.
Mastering Cyclical Storytelling with Segmented Charts
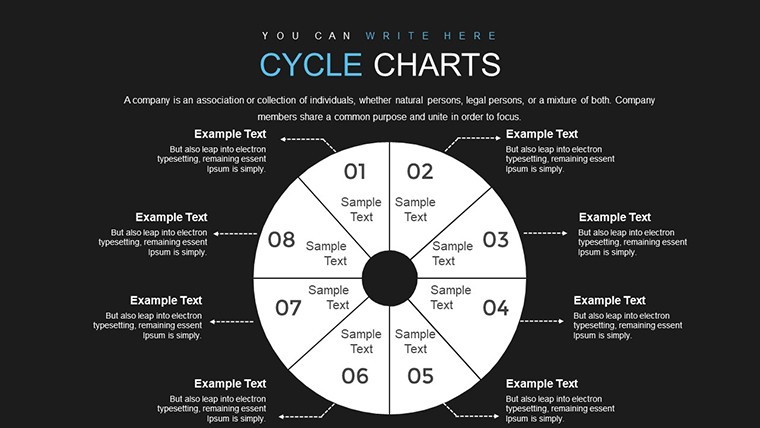
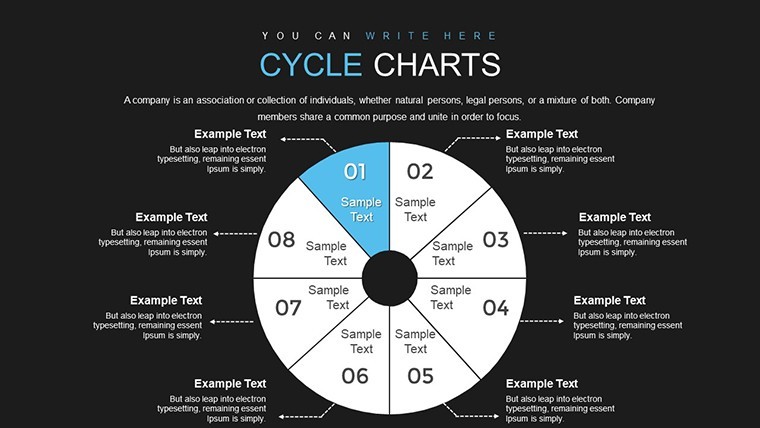
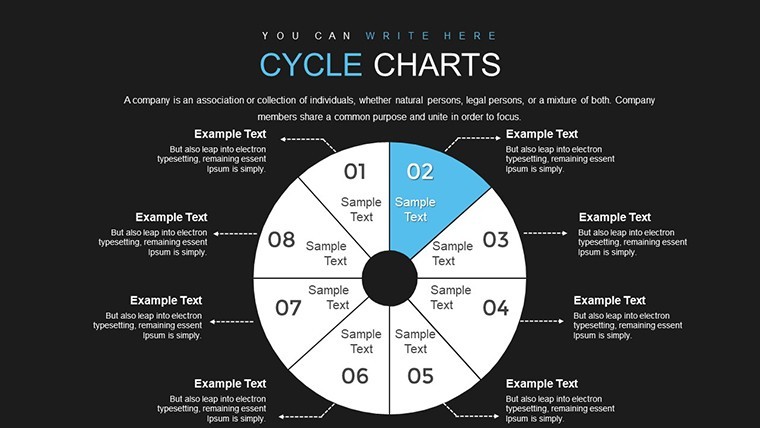
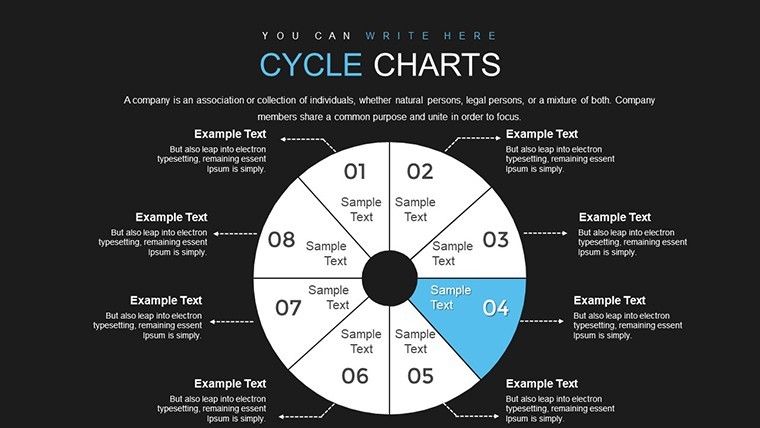
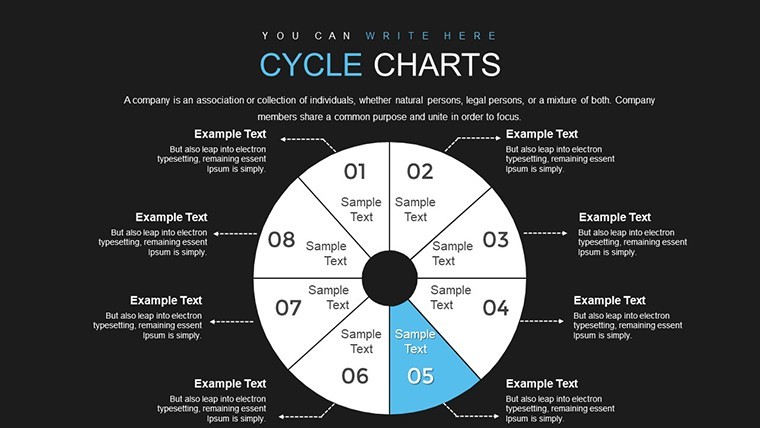
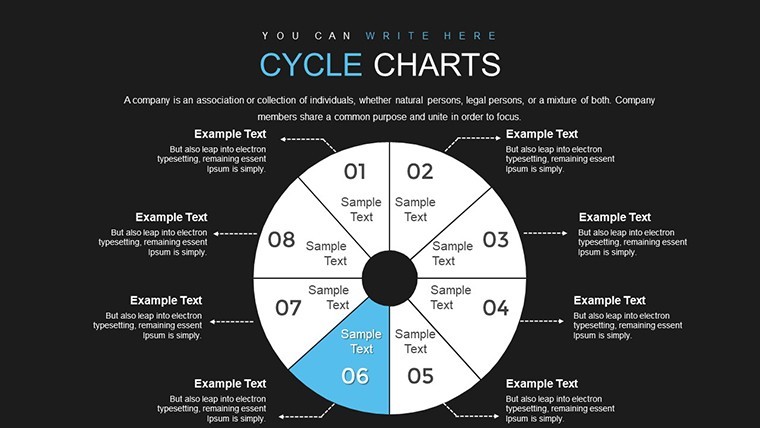
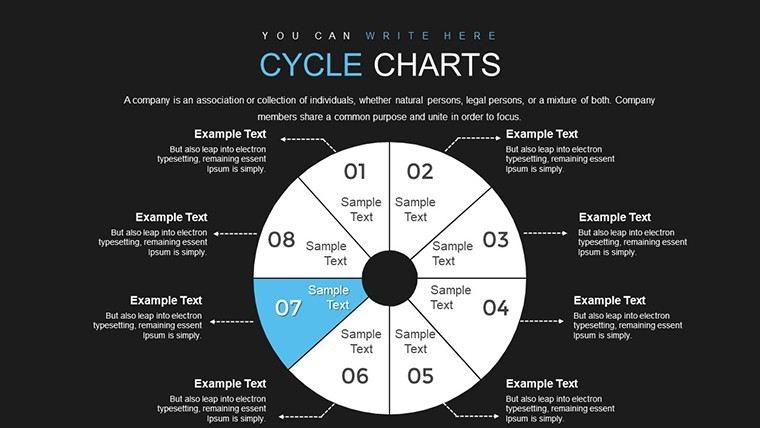
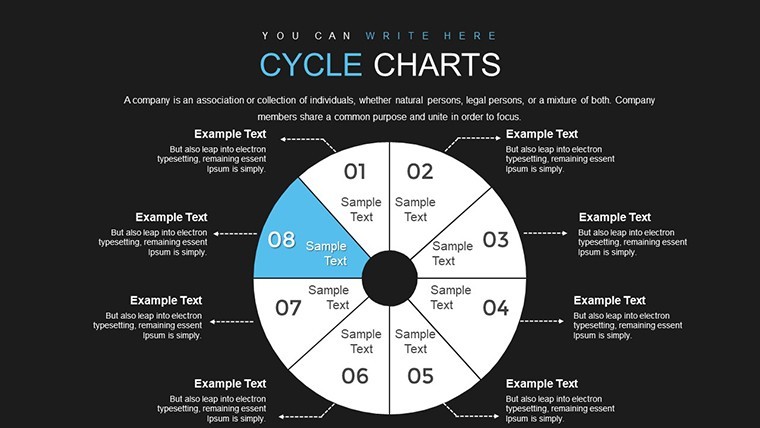
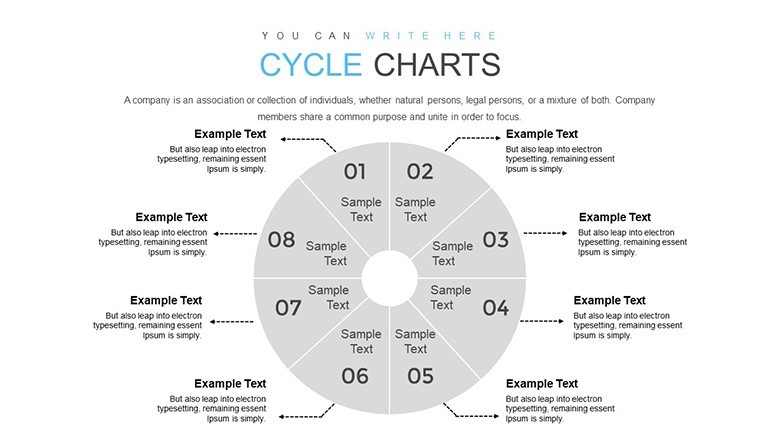
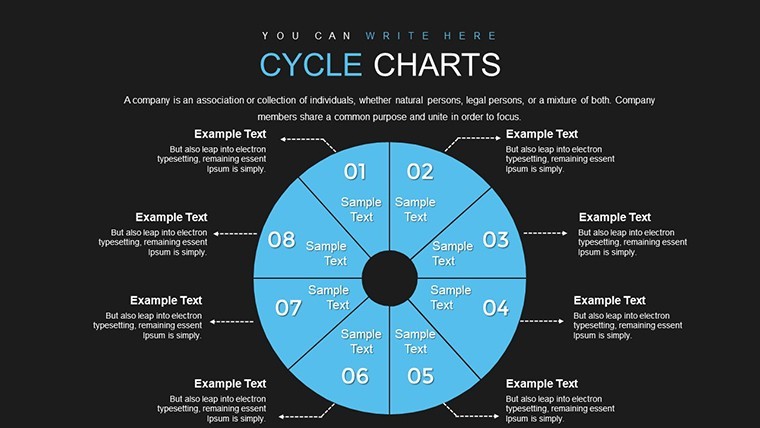
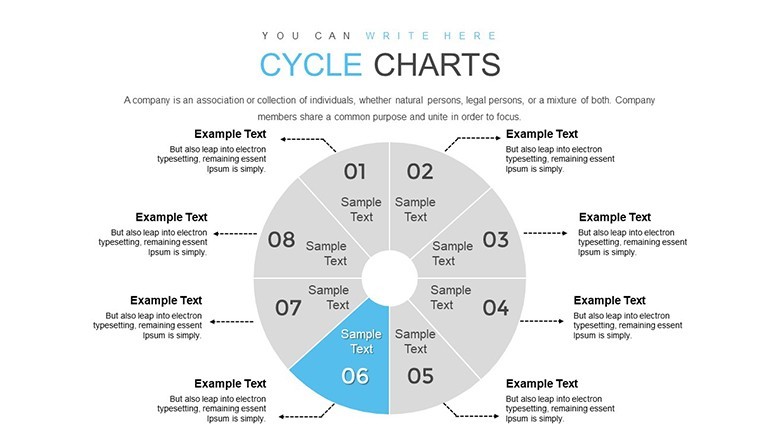
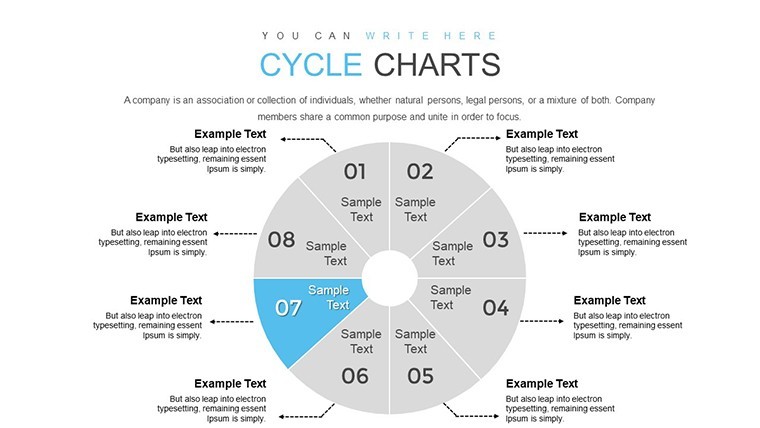
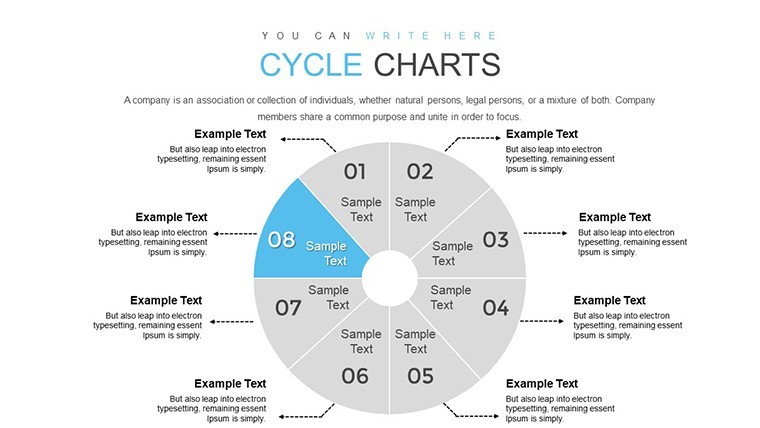
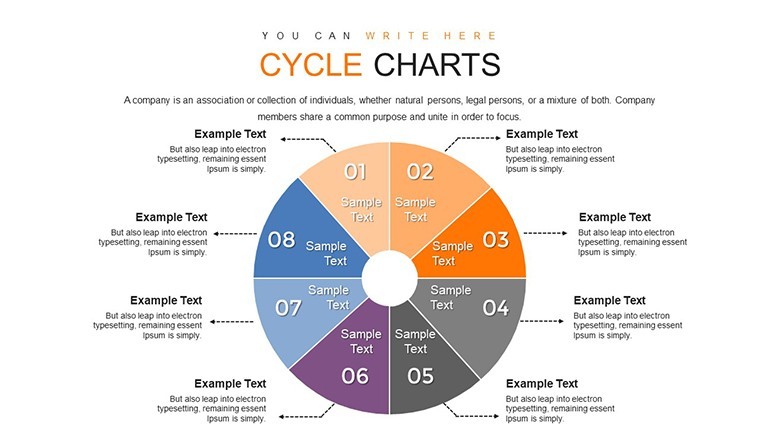
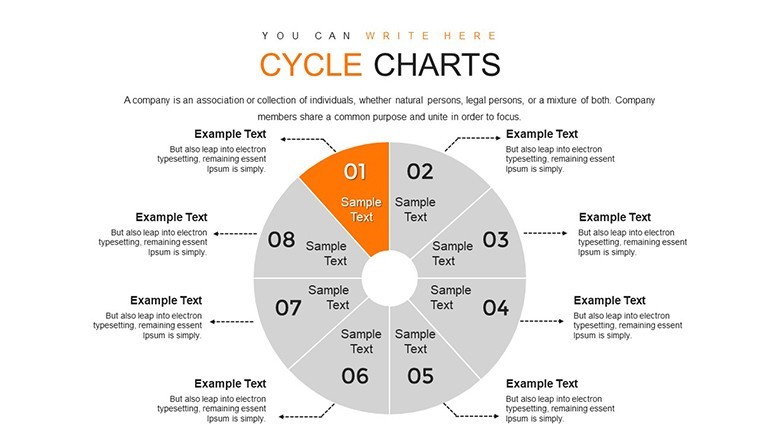
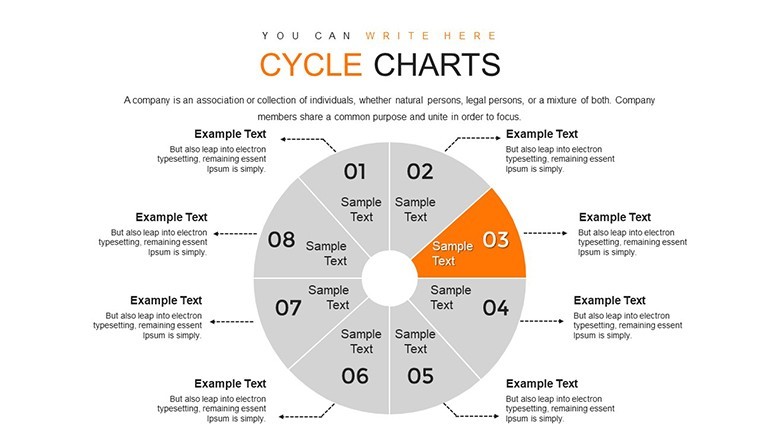
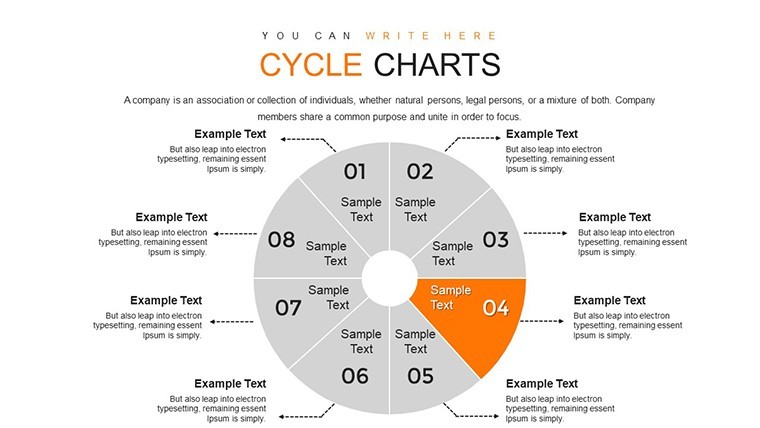
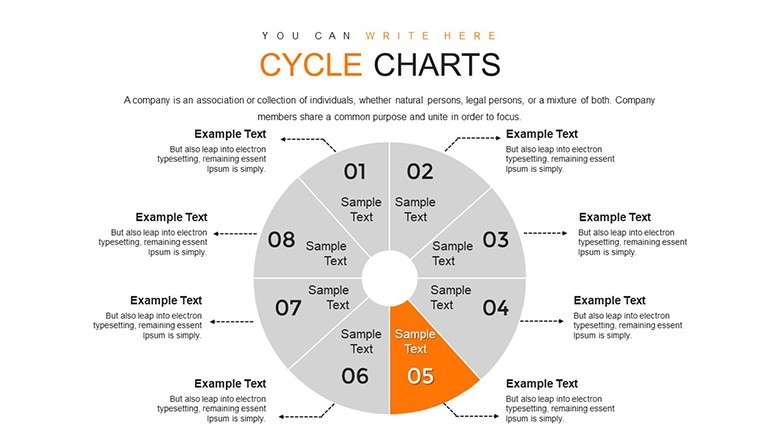
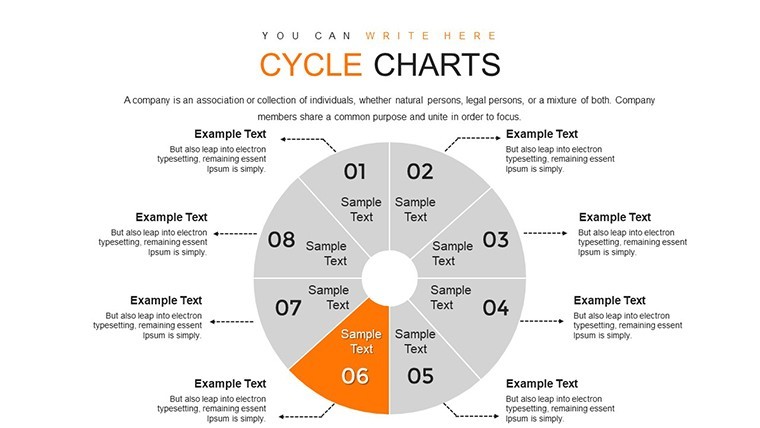
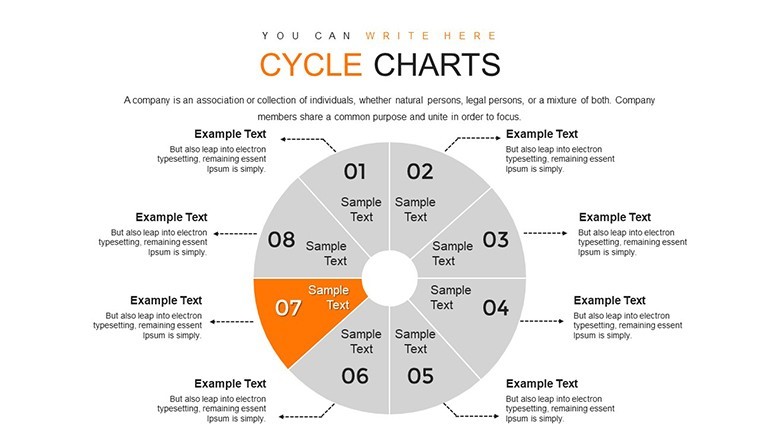
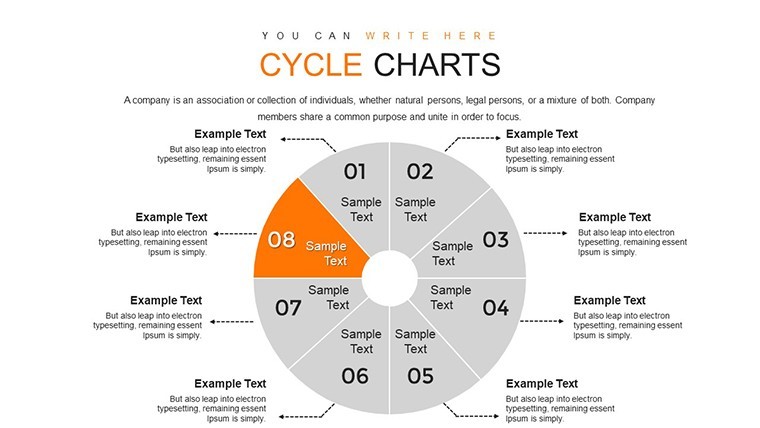
Cycles are everywhere in business and life, from product development phases to seasonal market trends. This template's 8-segment structure allows you to divide processes into clear, interconnected parts, using arcs and arrows to show progression. For example, in a marketing context, assign each segment to stages like awareness, consideration, and conversion, with data overlays for metrics like conversion rates. The built-in pie variations let you emphasize proportions, such as budget allocation across campaign channels.
Go beyond basics with layered cycles that incorporate timelines or hierarchies. These are invaluable for business analysts presenting SWOT cycles or feedback loops in quality management, aligned with ISO standards for process improvement. A real-world application? A consulting firm used a comparable template to visualize agile methodology cycles, helping clients adopt iterative practices that accelerated project delivery by 25%.
Seamless Customization for Brand Alignment
Personalization is key to making presentations your own. In Keynote, edit each segment's color, text, and icons effortlessly - opt for vibrant hues to denote energy in growth phases or muted tones for reflective stages. The template includes a library of cycle-specific icons, like gears for operations or arrows for transitions, enhancing visual storytelling without extra effort.
- Segment Editing: Resize or recolor individual parts to highlight priorities.
- Animation Options: Add subtle rotations to simulate movement, drawing from Keynote's animation toolkit.
- Layout Flexibility: Combine with text boxes for annotations, ensuring context is always clear.
This adaptability makes it suitable for solo creators or teams, with easy sharing via iCloud for collaborative refinements.
Practical Applications Across Industries
Dive into how this template excels in action. Marketing professionals can map out content calendars, using segments for monthly themes and pies for channel distributions. Business analysts might illustrate economic cycles, incorporating data from sources like the World Bank to forecast recessions or booms. Educators find it transformative for lessons on life cycles, such as in biology, where segments represent stages like germination to maturity, making abstract concepts concrete.
Sales teams benefit by visualizing the customer lifecycle, from lead generation to loyalty programs. In one instance, a tech sales group adapted cycle charts to show product adoption phases, impressing prospects and shortening sales cycles. For project managers, it's a go-to for Gantt-like cycles in Scrum sprints, fostering better team alignment.
Tips to Elevate Your Cycle Presentations
Craft cycles that captivate by following proven strategies. Limit segments to essentials - eight is ideal for balance without overload, as per cognitive load theory. Use consistent color coding across slides for intuitive navigation. Incorporate real data: Pull from Excel or Google Sheets to populate charts dynamically.
- Define your cycle's core: Identify the repeating elements first.
- Layer information: Use tooltips or notes for deeper dives.
- Rehearse delivery: Ensure transitions feel natural, like a well-oiled wheel.
These practices, inspired by presentation masters, turn your deck into a dynamic experience.
Elevate Your Presentations to New Heights
This 8 Segment Cycle Keynote Charts Template isn't just a file - it's a catalyst for clearer communication and stronger impacts. With 34 slides offering variations from simple loops to intricate interconnections, it covers all bases for cyclical narratives. Feedback from users highlights its role in making presentations more memorable and actionable. Don't let your ideas go in circles without purpose; harness this template to drive them forward.
Ready to revolutionize how you present cycles? Secure your download today and start engaging like never before.
Frequently Asked Questions
- What makes the 8-segment structure unique?
- It provides balanced division for processes, allowing detailed yet concise visualizations without overwhelming the audience.
- Can I add more segments if needed?
- Yes, the editable nature lets you duplicate or modify segments in Keynote for custom cycles.
- Is this suitable for non-business uses?
- Absolutely, educators and trainers use it for conceptual cycles in science or history lessons.
- How do I integrate data into the charts?
- Simply input values into placeholders; Keynote handles the scaling automatically.
- Are animations pre-set?
- Basic ones are included, but you can customize for emphasis on cycle progression.
- What's the best way to export this template?
- Export to PDF for sharing or video for online presentations, preserving cycle dynamics.

