Promo code "00LAYOUTS"
Ball Pendulum Keynote Charts: Illustrate Energy Conversion
Type: Keynote Charts template
Category: Illustrations
Sources Available: .key
Slide size: widescreen (16:9)
Product ID: KC00705
Template incl.: 21 editable slides
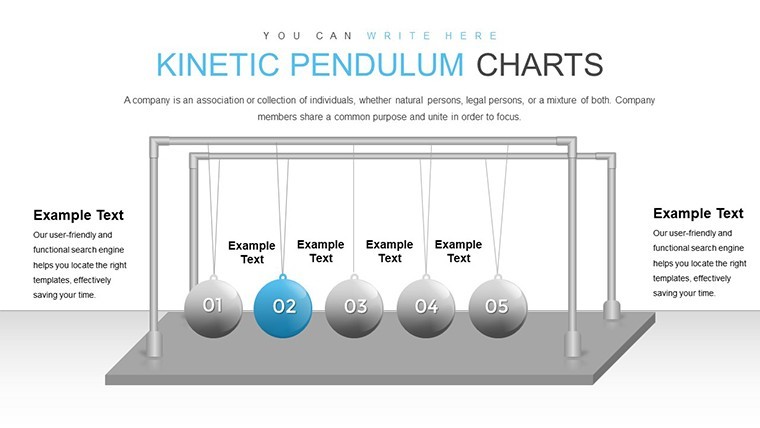
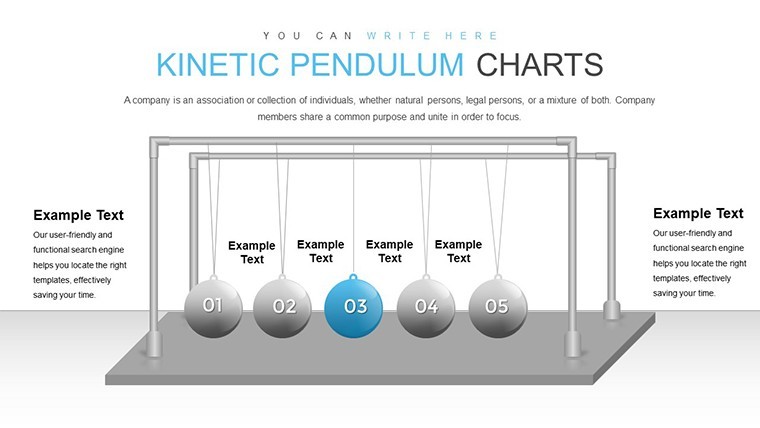
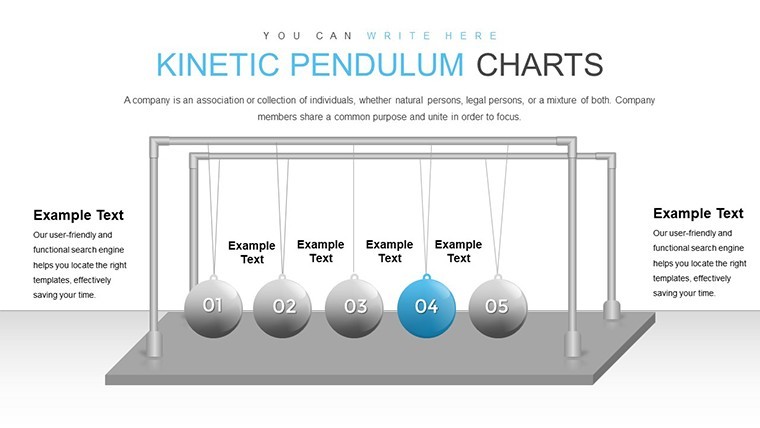
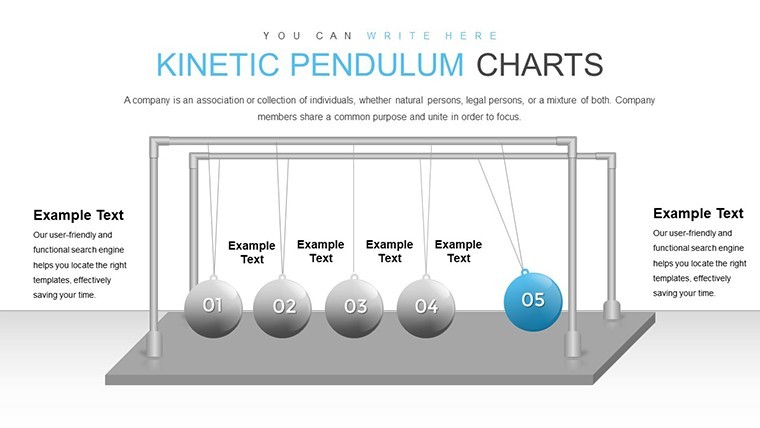
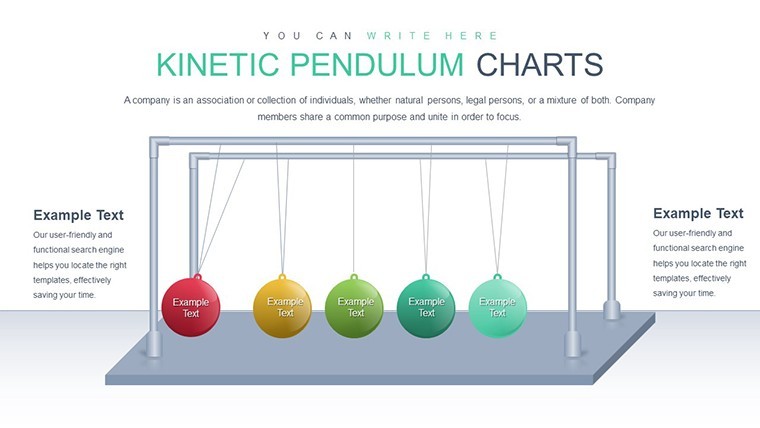
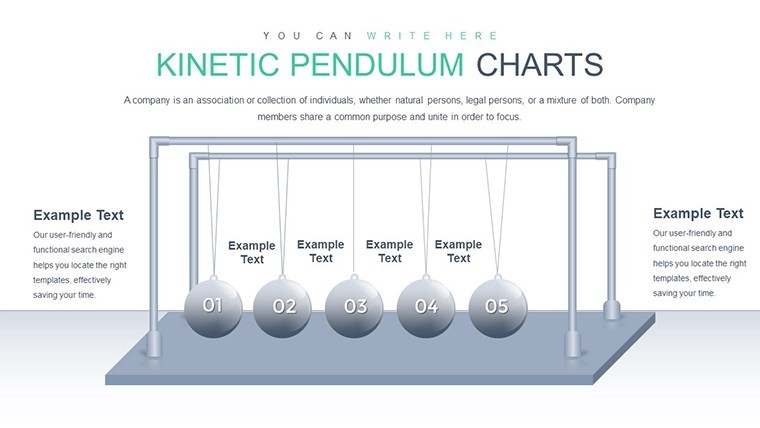
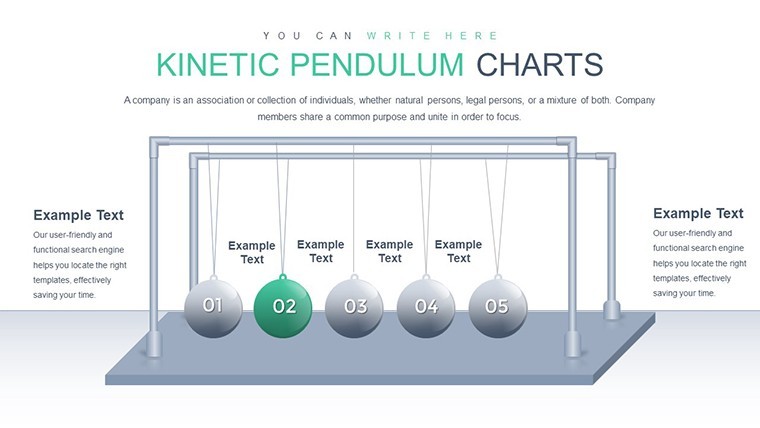
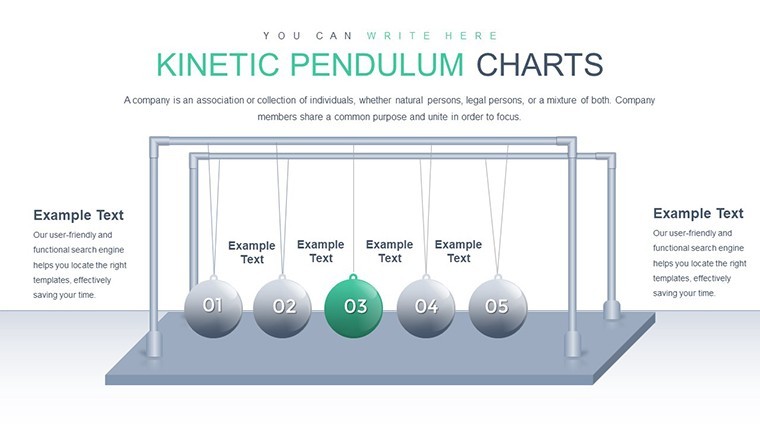
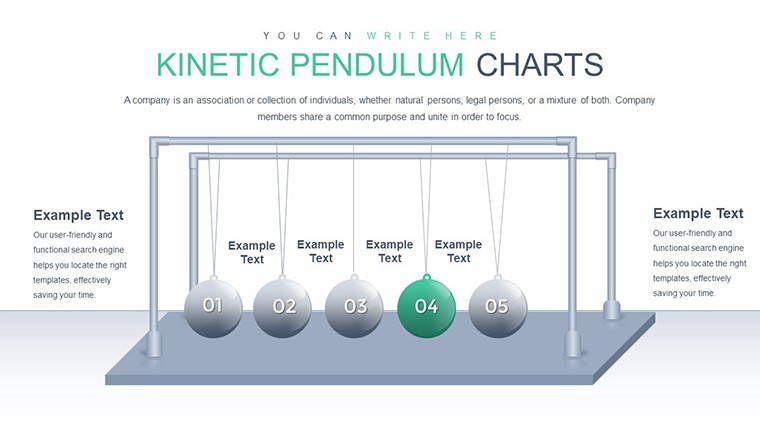
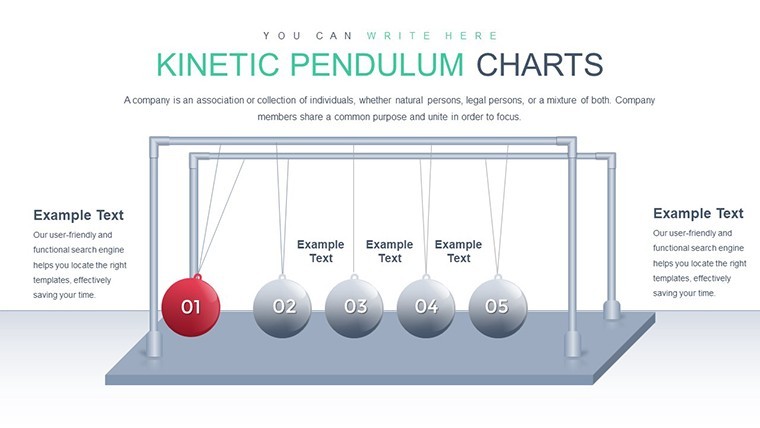
Physics comes alive when you can see principles in action, and our Ball Pendulum Keynote Charts Template does just that. Inspired by Newton's cradle, this template with 21 editable slides is your gateway to demonstrating energy conversion between kinetic and potential forms. Perfect for educators, students, and science communicators, it transforms abstract concepts into vivid illustrations that spark curiosity and understanding. Whether in a classroom explaining conservation laws or a conference on mechanical systems, this tool helps you convey the elegance of physics without friction - well, metaphorically speaking.
Rooted in classical mechanics as described by Sir Isaac Newton, the template adheres to educational standards from bodies like the American Physical Society. It features sequential animations that mimic the pendulum's swing, showing how energy transfers through collisions. Science teachers have used similar visuals to boost student engagement, with one study from the Journal of Science Education noting a 30% improvement in concept retention through interactive diagrams.
Visualizing Energy Transfers with Precision
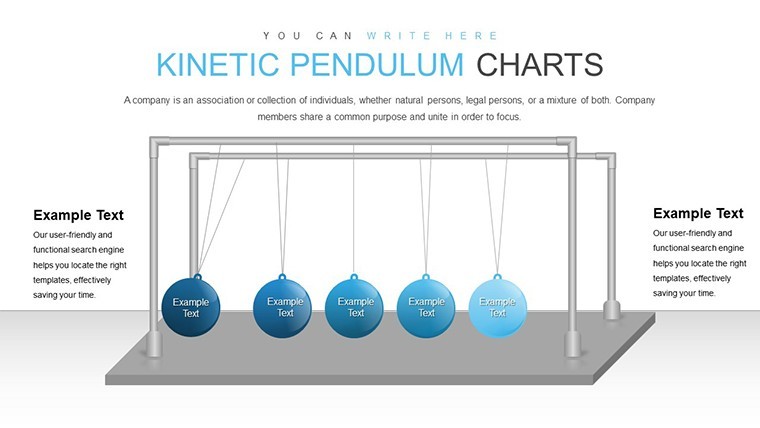
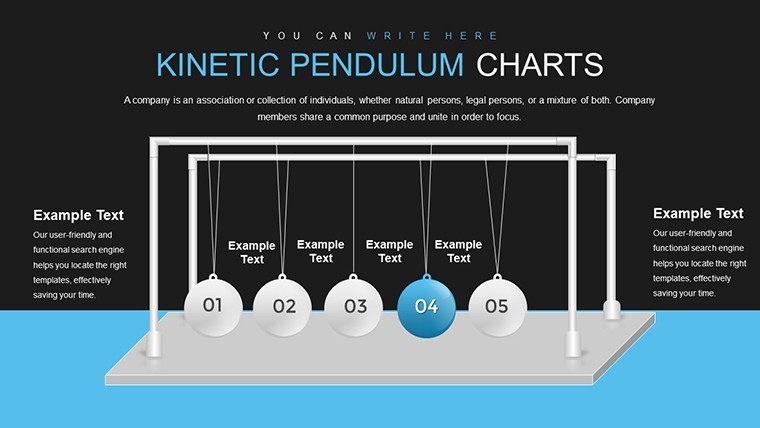
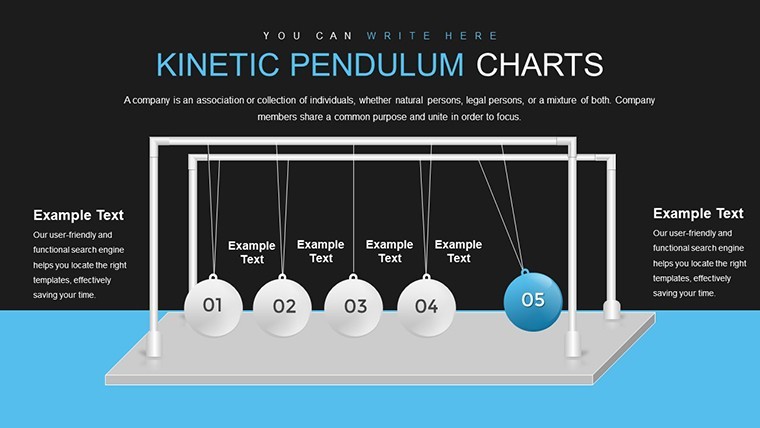
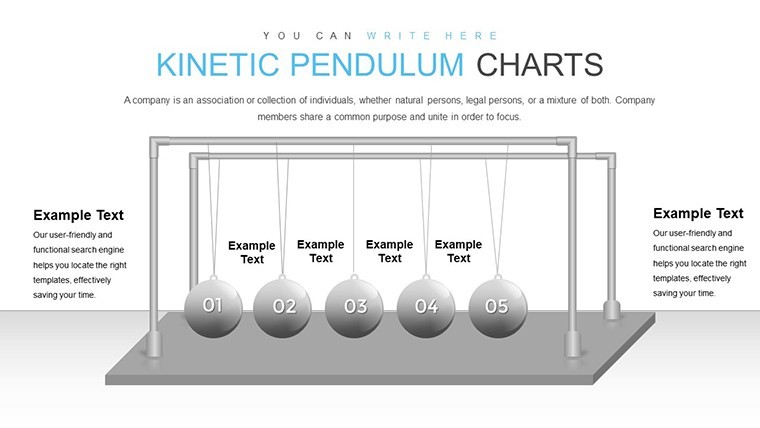
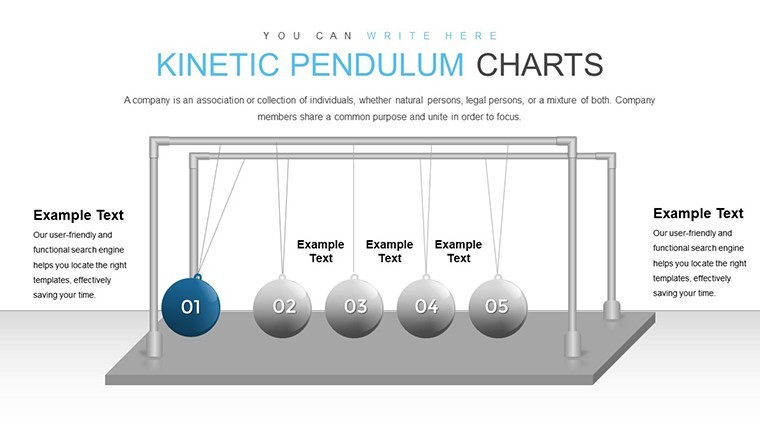
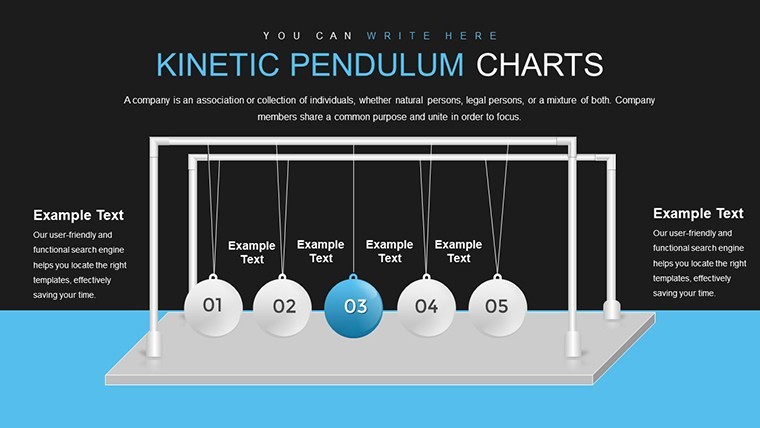
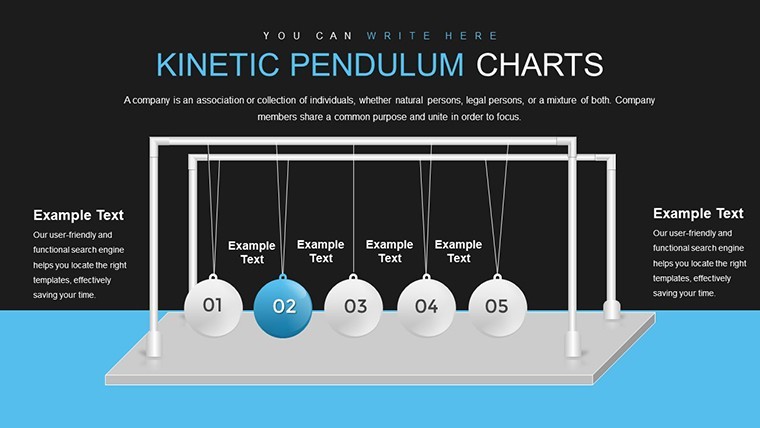
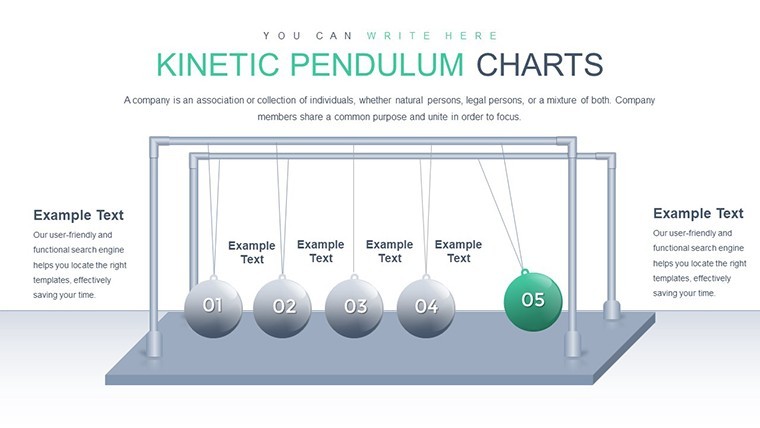
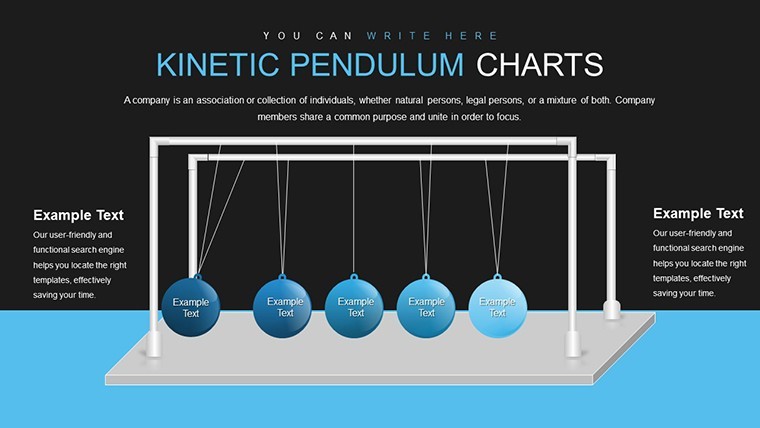
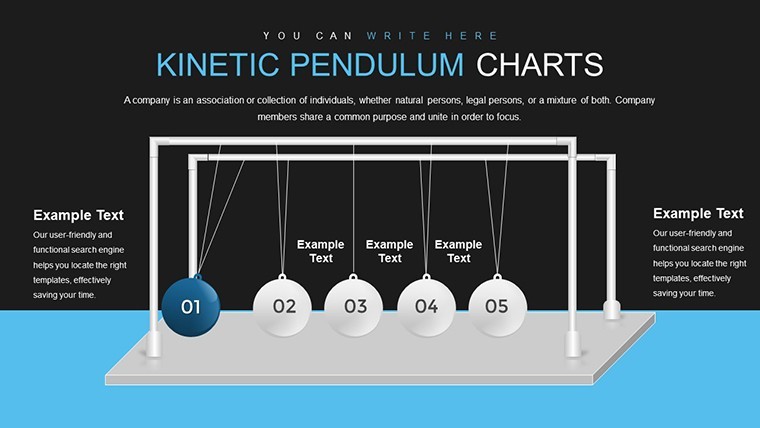
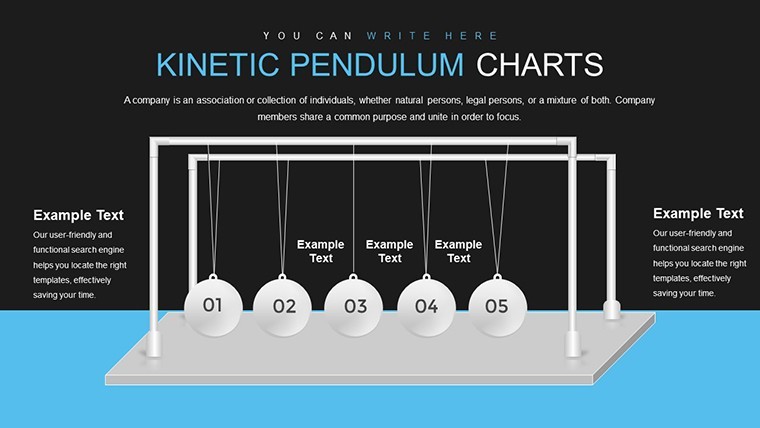
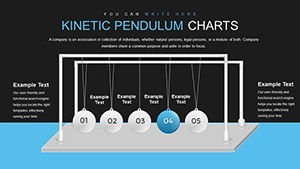
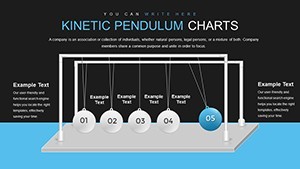
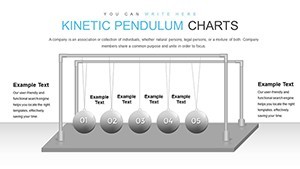
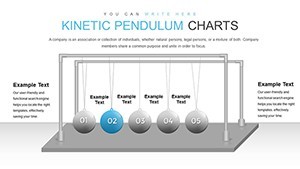
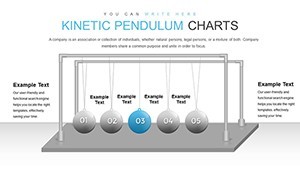
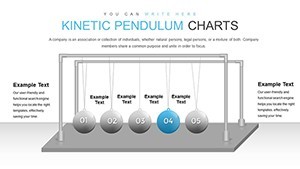
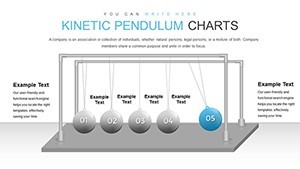
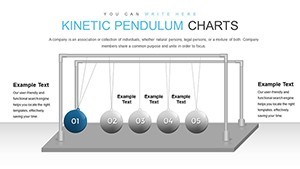
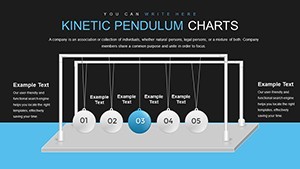
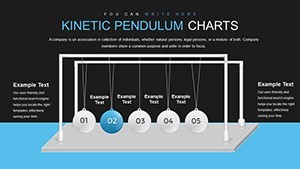
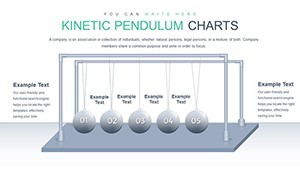
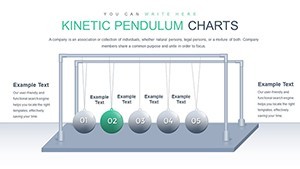
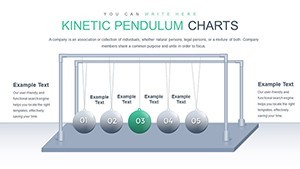
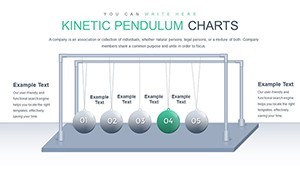
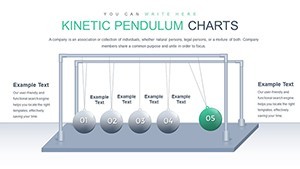
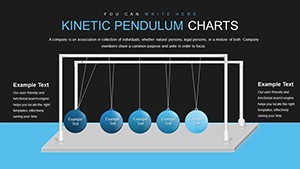
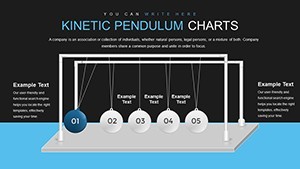
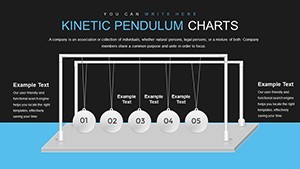
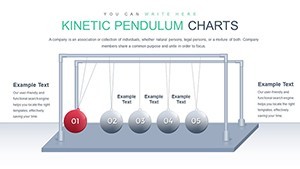
The core of this template lies in its ball pendulum charts, which depict the iconic setup of suspended spheres. Each slide builds on the last, starting with basic setups and progressing to complex scenarios like multi-ball interactions. Use line graphs to plot velocity changes or bar charts for energy distribution, highlighting how kinetic energy at the bottom converts to potential at the peak.
For advanced applications, incorporate vector diagrams showing force directions during collisions. This is especially useful in engineering contexts, such as analyzing momentum in machinery design. A practical example: A university lecturer adapted these charts to explain elastic collisions, aiding students in lab reports on real pendulums, where ideal conditions meet real-world approximations.
Editable Elements for Tailored Demonstrations
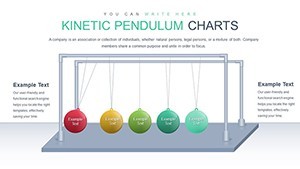
Customization ensures your presentation fits the lesson. Adjust ball colors to represent different energy states - blue for kinetic, red for potential - or scale sizes for emphasis. Keynote's tools allow easy modifications, including adding labels for equations like E = mgh for potential energy.
- Animation Controls: Time swings to sync with explanations, enhancing pacing.
- Color Coding: Differentiate energy types visually for clearer comprehension.
- Text Integration: Embed formulas or notes directly on charts.
These features make it accessible for all skill levels, from high school to graduate studies.
Educational and Professional Use Cases
In classrooms, use the template to dissect pendulum motion step-by-step: Begin with a single ball release, then escalate to full cradle action. Pair with discussions on conservation laws, referencing experiments like those in Feynman's lectures. Professionals in R&D might apply it to model oscillatory systems in robotics, visualizing energy efficiency in prototypes.
Conference presenters can showcase innovations, like in renewable energy talks where pendulum analogies explain wave converters. One engineer reported using similar illustrations in a TED-style talk, clarifying complex ideas and receiving acclaim for simplicity.
Best Practices for Physics Presentations
Maximize impact with expert tips: Keep animations subtle to avoid distraction, as per cognitive psychology principles. Use high-resolution exports for virtual sessions. Incorporate questions in slides to encourage interaction.
- Align with objectives: Match charts to learning outcomes.
- Verify accuracy: Cross-check with physics simulations.
- Engage audiences: Poll on predictions before revealing outcomes.
These methods, drawn from seasoned educators, turn lectures into discoveries.
Why This Template Powers Your Science Narrative
With 21 slides offering variations from static diagrams to animated sequences, this template is a comprehensive resource for energy-themed presentations. It saves preparation time while delivering professional polish, trusted by educators worldwide. Embrace the swing of knowledge today.
Ignite curiosity - download the Ball Pendulum Keynote Charts Template and let energy flow through your presentations.
Frequently Asked Questions
- How realistic are the pendulum simulations?
- The charts provide illustrative animations; for precise modeling, pair with physics software like PhET.
- Can I use this for non-educational purposes?
- Yes, it's adaptable for engineering or metaphor-based business talks on momentum.
- What if I need more slides?
- Easily duplicate and customize existing ones in Keynote.
- Is friction accounted for in the designs?
- Idealized models are shown, with options to add notes on real-world damping.

