Cycle Relationship Keynote Charts - Editable Keynote


Type: Keynote Charts template
Category: Cycle
Sources Available: .key
Product ID: KC00701
Template incl.: 19 editable slides
19 Keynote chart slides for mapping cyclical relationships and multi-indicator processes
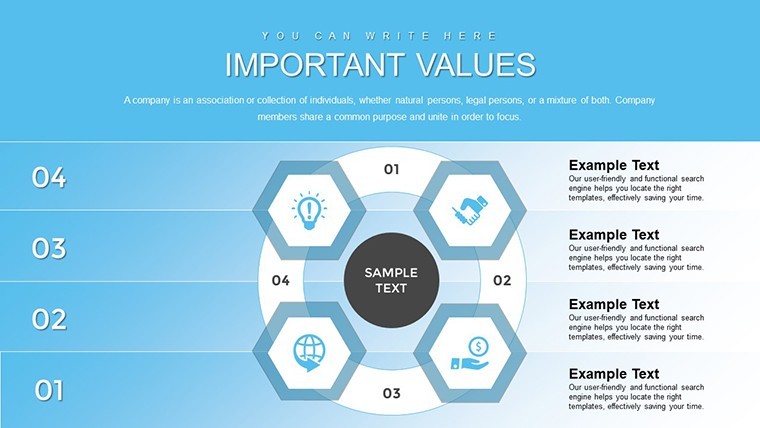
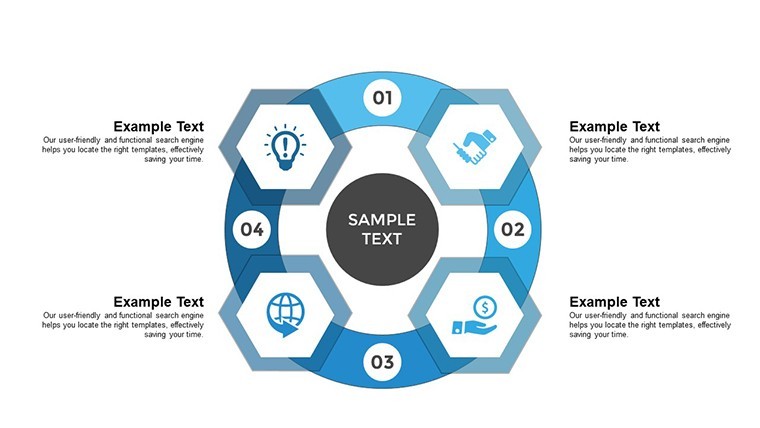
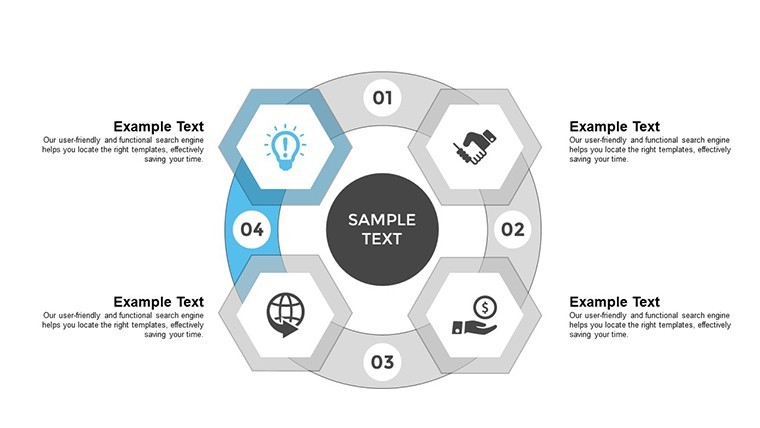
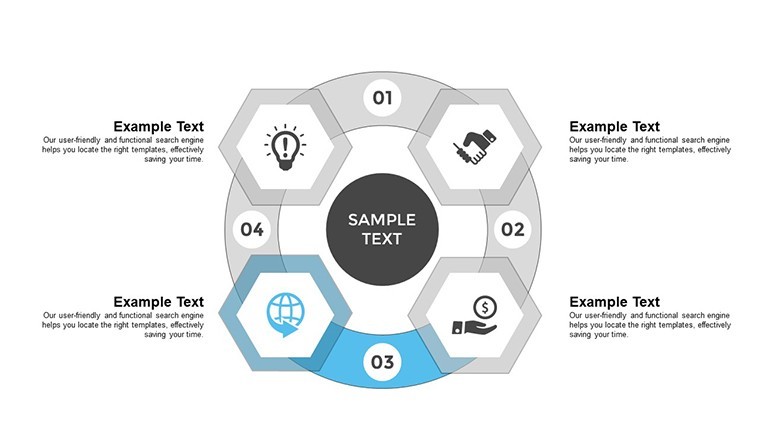
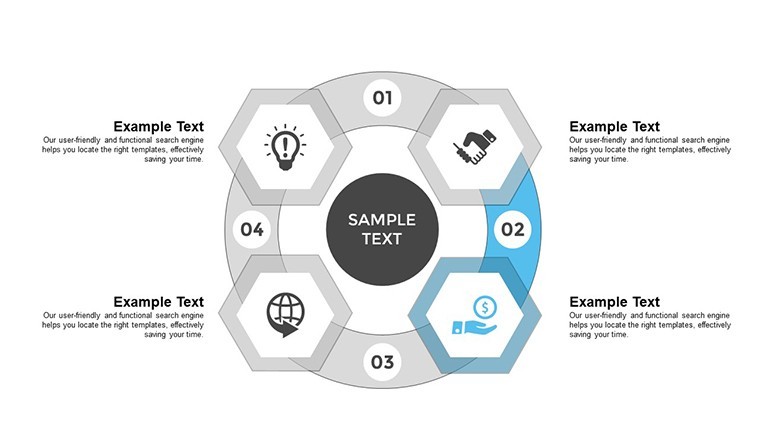
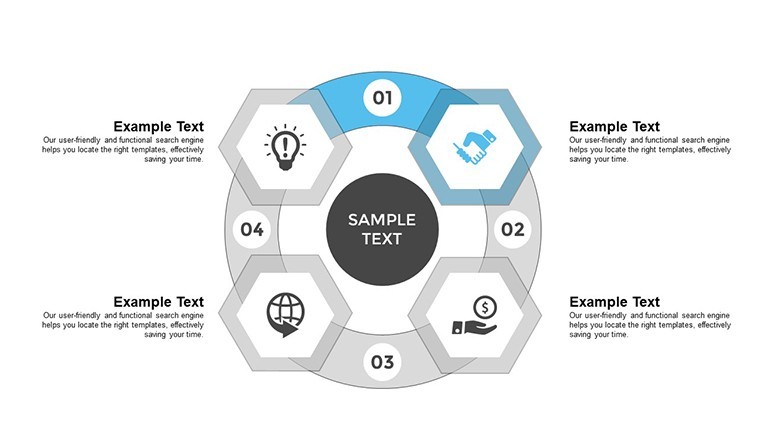
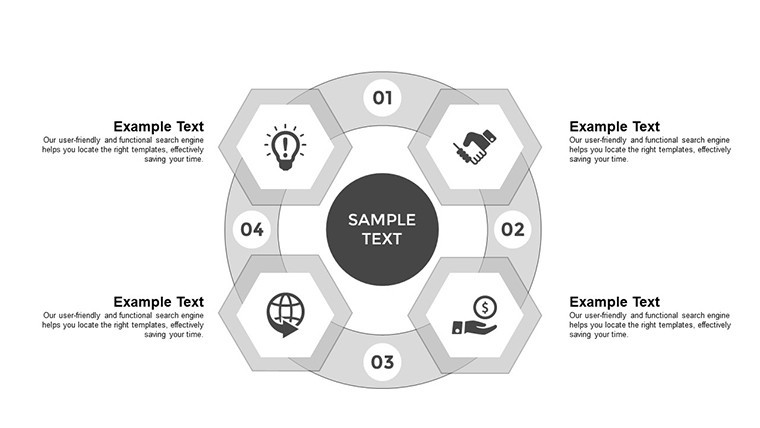
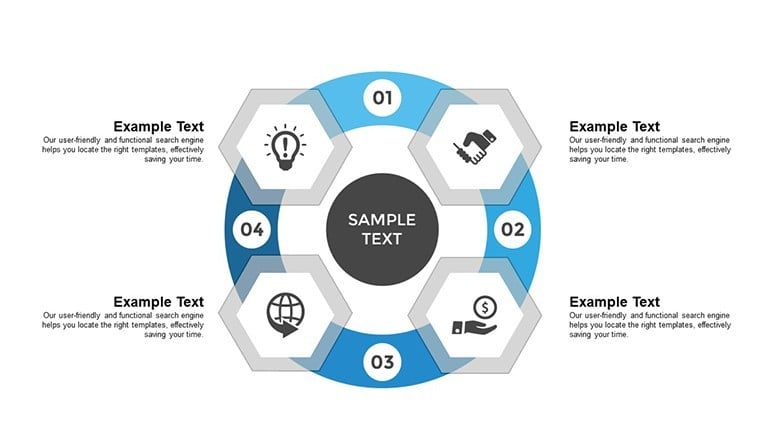
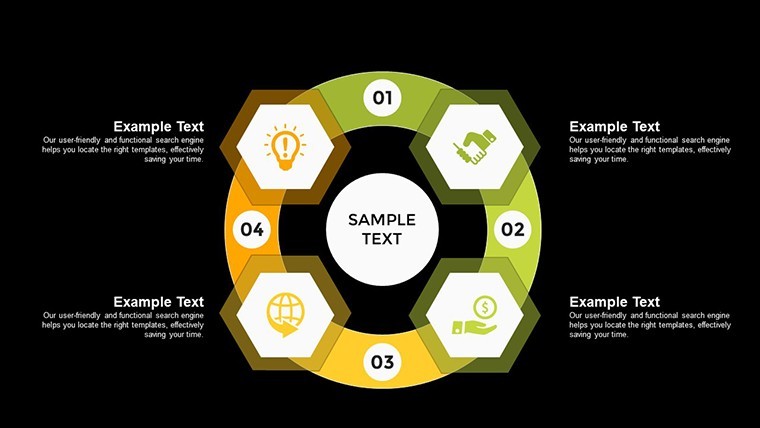
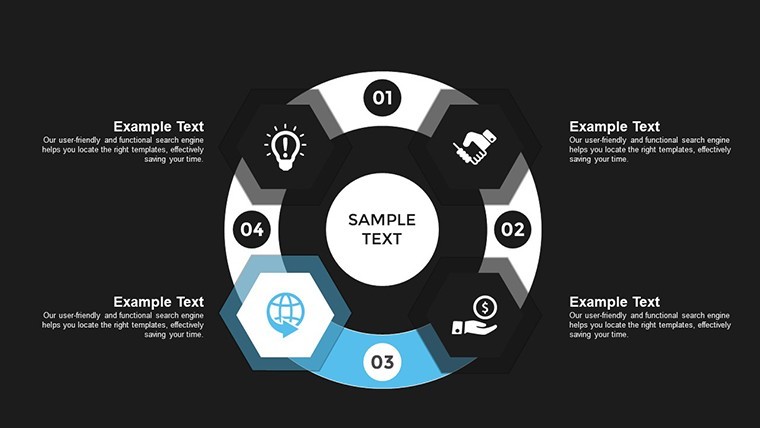
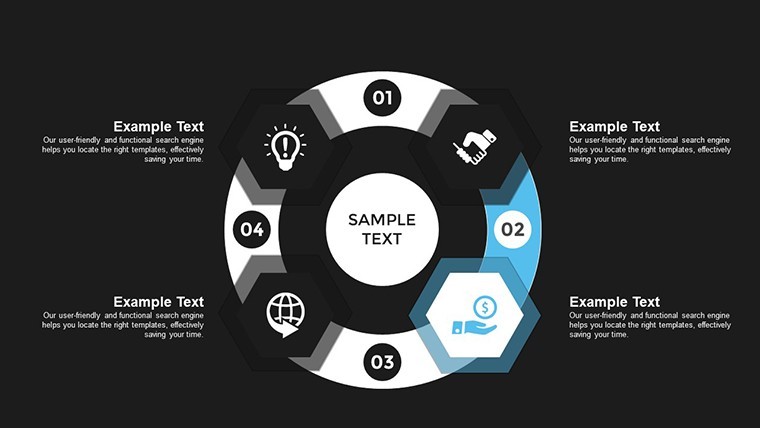
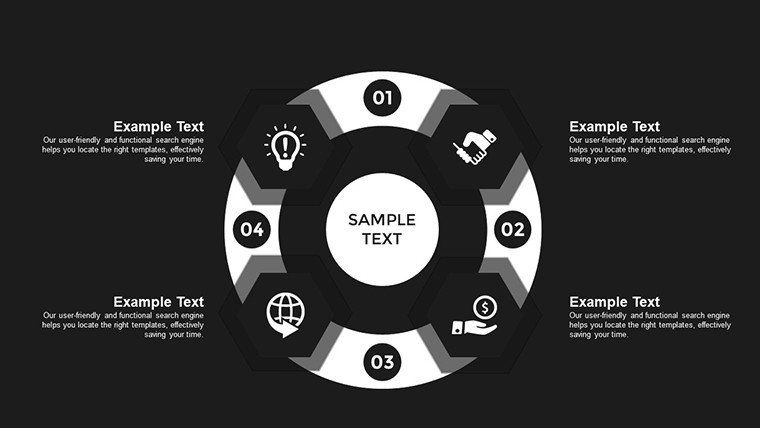
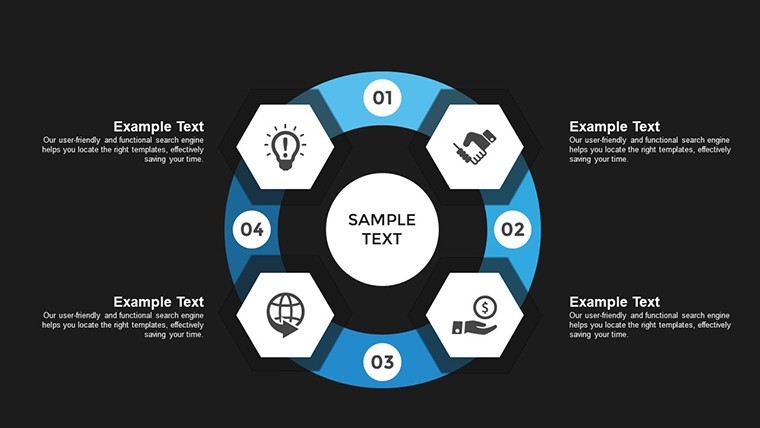
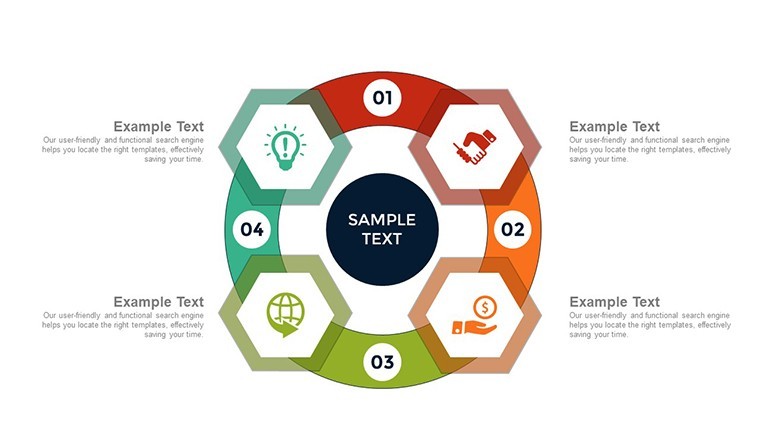
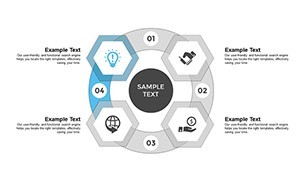
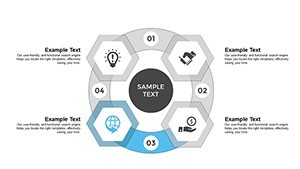
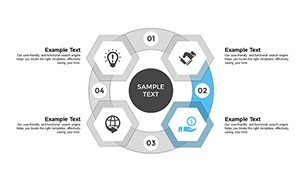
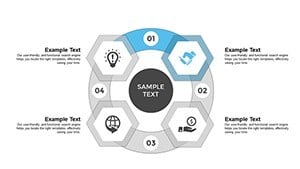
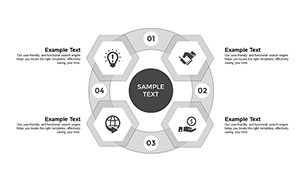
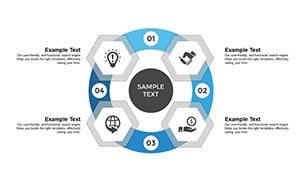
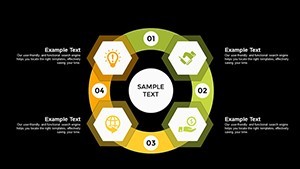
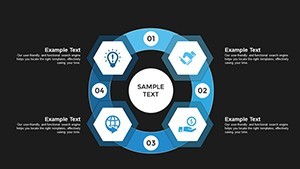
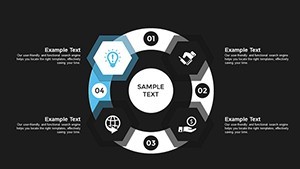
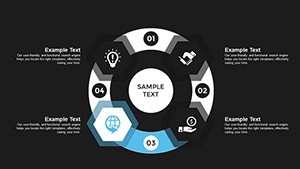
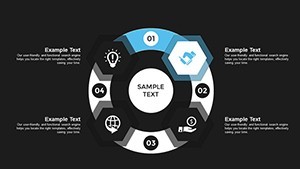
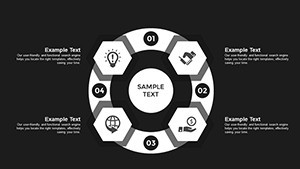
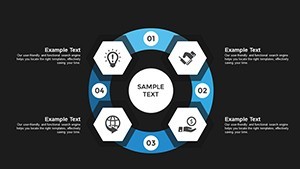
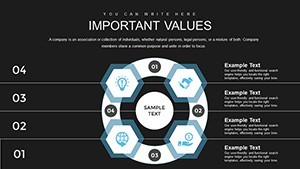
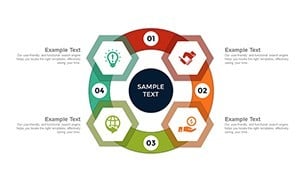
For business analysts or project managers who need to show how multiple elements feed into and out of each other - supply chains, feedback loops, accounting cycles, or organizational interdependencies - this Keynote chart template provides 19 editable slides in .key format. The base layout in each slide places four indicators in a circular arrangement with directional arrows connecting them, forming a closed cycle. The slides are built to be scalable: you reduce element sizes, duplicate the shapes, and realign them around the center to accommodate more indicators, going from four up to eight or beyond without breaking the circular symmetry.
Each layout uses a radial arrangement - nodes positioned at equidistant points around a shared center, connected by curved or straight directional arrows that indicate flow direction. The structure is flat and outline-based, with labeled node containers and arrow connectors as separate, independently editable elements. This keeps the diagram readable on a single slide even when the number of indicators increases, since the circular format distributes the labels evenly rather than stacking them vertically. Contrast this with a linear flowchart: a cycle diagram shows that each step influences the next and eventually loops back, clarifying mutual dependency rather than one-way progression.
The diagram type supports relationship mapping - an analysis approach used when you need to show that elements in a system are mutually dependent rather than hierarchically ordered. A business development team, for example, can use this to map the relationship between pipeline generation, client onboarding, delivery, and referral, showing the audience that each phase feeds directly into the next rather than ending at delivery. After viewing this kind of diagram, a decision-maker can identify which node in the cycle is creating a bottleneck or breaking the feedback loop.
Works best for structured cyclical processes with a defined number of stages. Not ideal if you need to show a strict linear sequence where the order is the main point, or if the relationship between stages is non-reciprocal. Color editing is done per element through Keynote's Format panel - select a node or arrow and update the fill or stroke color directly. Typically, teams replace the node labels and arrow text, adjust the fill colors to match brand guidelines, and duplicate the slide for use in recurring quarterly review decks.
The .key file is Keynote-native and follows the standard KEY format compatible with current macOS installations; the page does not specify a minimum version. No free tier is listed - all 19 slides are included at $13.00. The set works across multiple report types: the same cycle diagram structure can be reused for different business processes simply by relabeling the nodes.
Everything is already structured. Download and start editing immediately
Specifications
| Feature | Details |
|---|---|
| Slides | 19 editable slides - circular multi-indicator cycle diagrams, scalable from 4 to 8+ nodes |
| File format | .key (Keynote native) |
| Software compatibility | Keynote (macOS); minimum version not specified - standard KEY format |
| Editable elements | Node containers, directional arrows, text labels - each editable and repositionable independently |
| Aspect ratio | Not specified on page |
| Color schemes | Not specified - editable per element via Keynote Format panel |
| Free vs Paid | Single paid version only - $13.00 for all 19 slides |
| Product ID | KC00701 |
Frequently Asked Questions
What Keynote version is required and does this work on current macOS?
The file uses the .key format, which is Keynote's native format for macOS. The product page does not specify a minimum version, but the standard KEY format is supported by Keynote 10 and later on current macOS systems. No conversion or additional software is needed. Keynote for iPad can also open the file, though editing multi-node circular diagrams is more practical on a Mac desktop.
How do I change colors on the cycle nodes and arrows?
Select any node shape or arrow connector on a slide, then open Keynote's Format panel and update the fill or stroke color in the Style tab. Since no master color switcher is confirmed for this file, the most efficient approach is to select all matching elements - for example, all node containers - and apply the fill in one step. Arrow connectors are separate elements and can be recolored independently from the node shapes.
Can this template be used in commercial and client-facing work?
ImagineLayout's standard license covers professional use including presentations delivered to clients or used in commercial projects. The license does not permit resale or redistribution of the template files as standalone products. Review the Terms of Use at imaginelayout.com/terms/ for full licensing details relevant to your use case.
Is there a free version or trial download?
The page lists a single paid version at $13.00 with no free file or partial download. All 19 slides are included in the purchased .key file. Full-size preview images are available for every slide on the product page, giving a clear view of the layouts and node structures before purchase.
What is the refund policy?
ImagineLayout refunds non-delivered purchases reported within 14 days of the order. Templates with major usability defects can be reported within 72 hours of purchase for a refund review. If the product does not match its description, the case is reviewed individually. Downloaded and used templates are generally not eligible for refunds unless a valid defect is demonstrated. Contact support with your order number and a clear description of the issue.
Find more cycle-based layouts in the Cycle Keynote Charts category or compare with the Step and Cycle Infographic Keynote Template.