Cloud Services Infographic Keynote Charts Template


Type: Keynote Charts template
Category: Relationship, Illustrations
Sources Available: .key
Product ID: KC00679
Template incl.: 34 editable slides
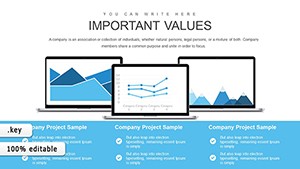
In the era of digital transformation, cloud services are the backbone of modern business, and presenting their intricacies demands visuals that cut through the noise. Our Cloud Services Keynote charts template delivers just that: a comprehensive set of 34 editable slides packed with infographics, charts, and graphs tailored for cloud computing narratives. Aimed at IT professionals, cloud architects, and business leaders, this template turns abstract concepts like SaaS, PaaS, and IaaS into tangible, engaging stories. Whether you're pitching migration strategies to executives or training teams on hybrid cloud setups, these slides provide the canvas to illustrate benefits like scalability, cost-efficiency, and security with flair.
Drawing from real-world cloud adoption trends - as highlighted in Gartner's reports where 85% of enterprises use multi-cloud strategies - this template equips you to showcase data with authority. High-quality designs ensure your presentations align with industry standards, fostering trust and demonstrating expertise in cloud ecosystems. Compatible with Keynote, it offers drag-and-drop ease, letting you focus on insights rather than design hurdles.
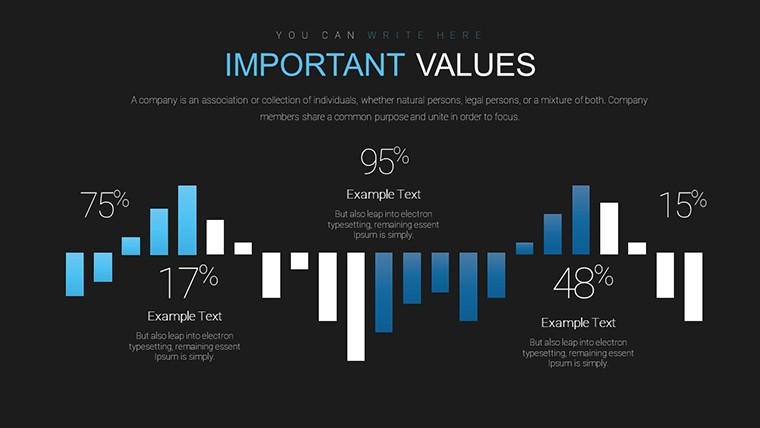
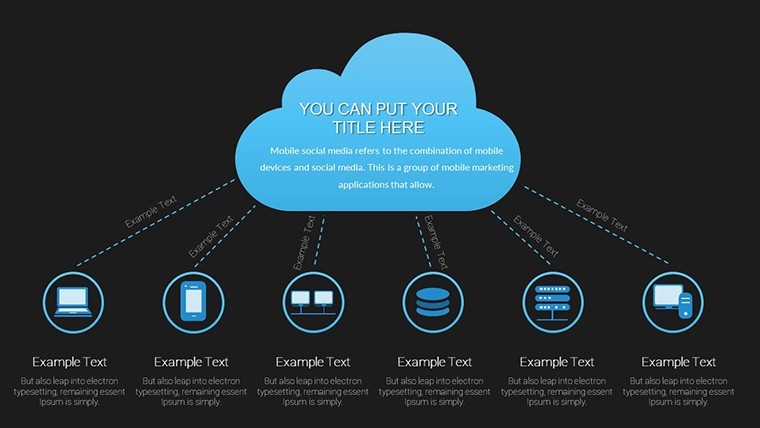
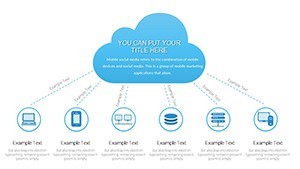
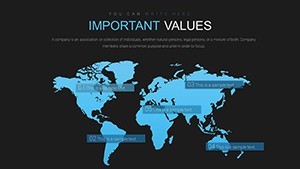
Picture this: A sales meeting where your infographic slides vividly map cloud cost savings, using bar graphs to compare on-premise vs. cloud expenses. Or a project update where flow diagrams outline deployment pipelines, making DevOps processes crystal clear. This isn't generic; it's specialized for cloud themes, with elements like cloud icons, network diagrams, and data flow visuals that resonate in tech-savvy audiences.
Essential Features for Cloud-Focused Presentations
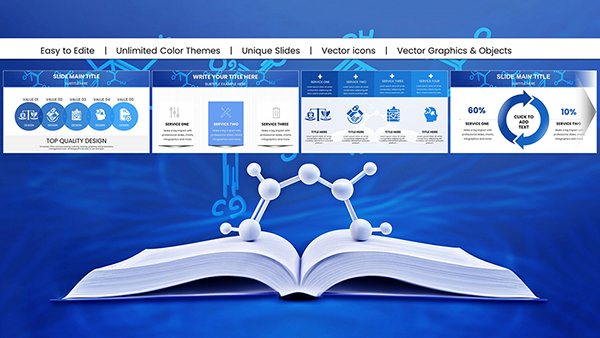
The template's core strength is its array of customizable features, built to adapt to your specific cloud narratives. Each slide is professionally designed, with vector graphics that maintain sharpness across devices.
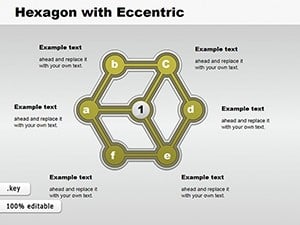
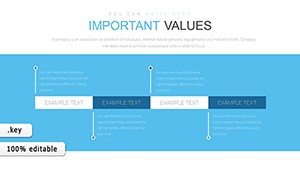
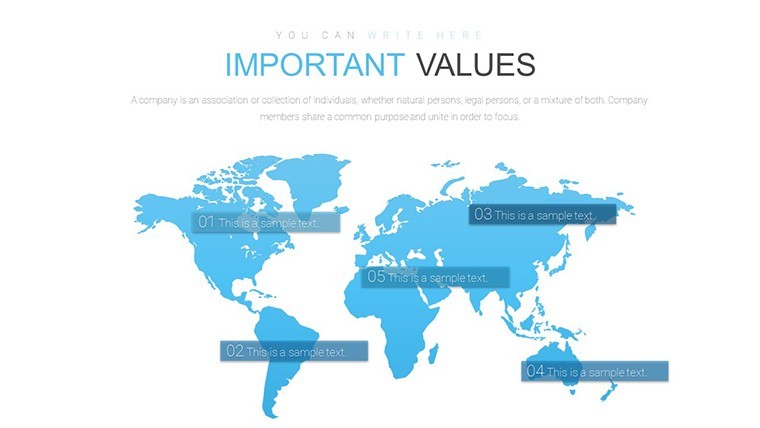
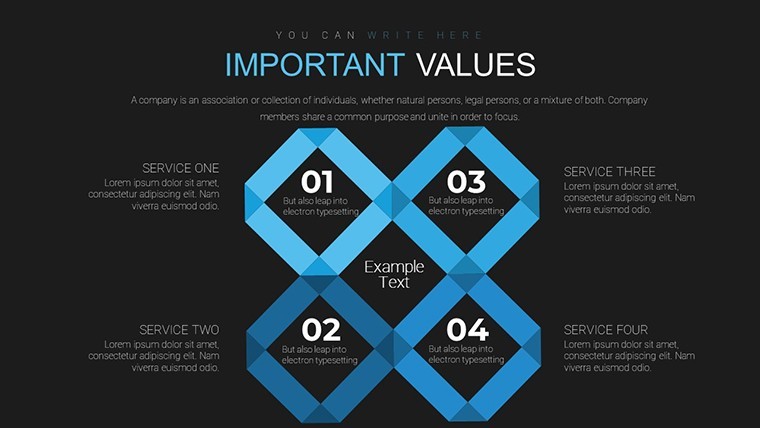
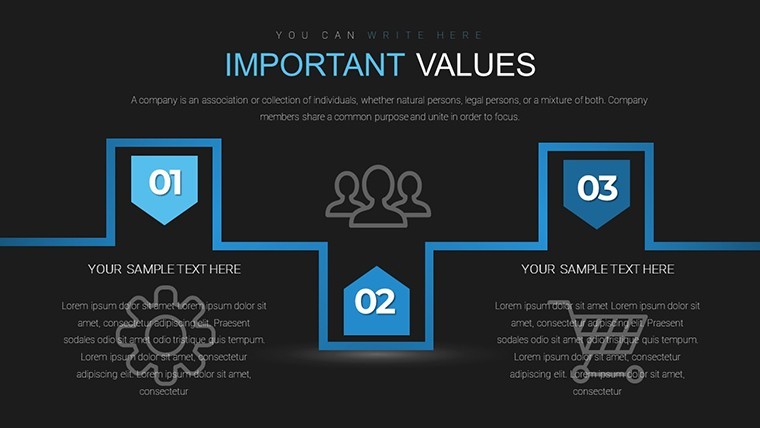
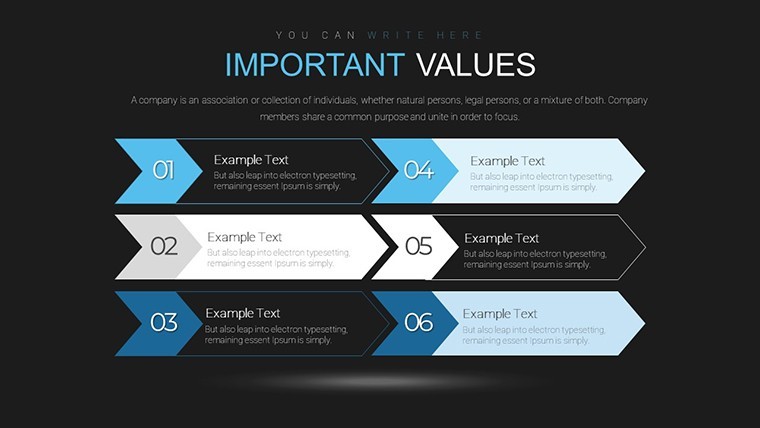
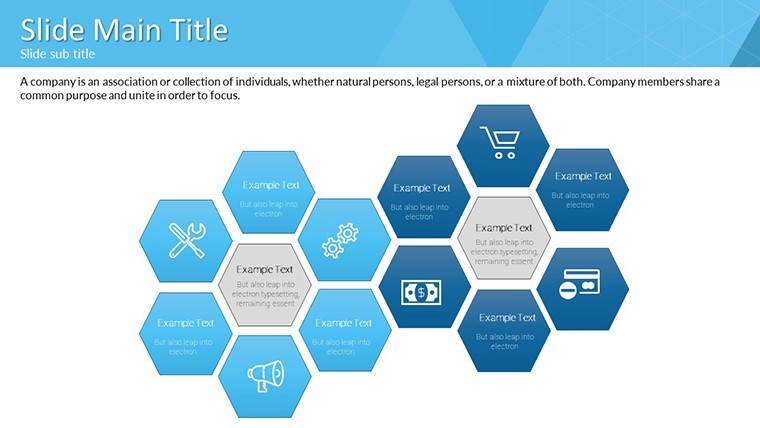
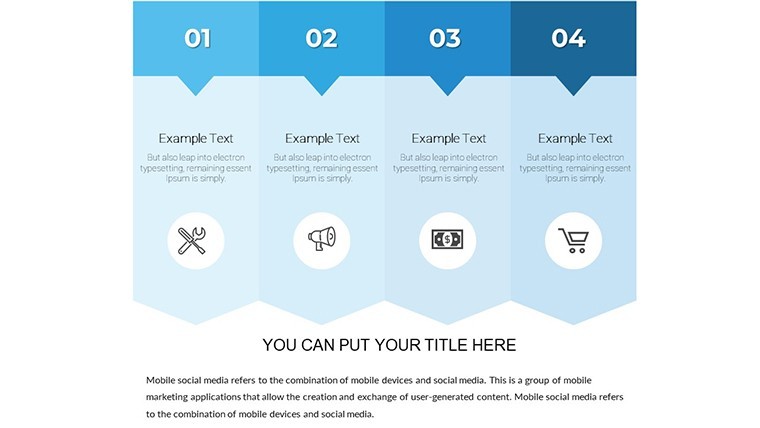
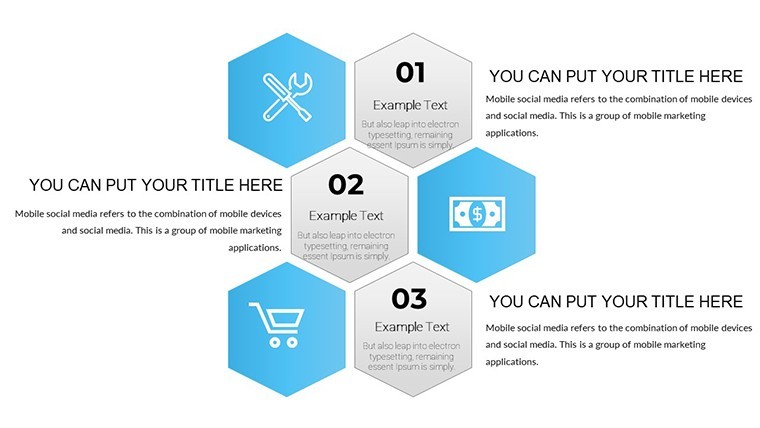
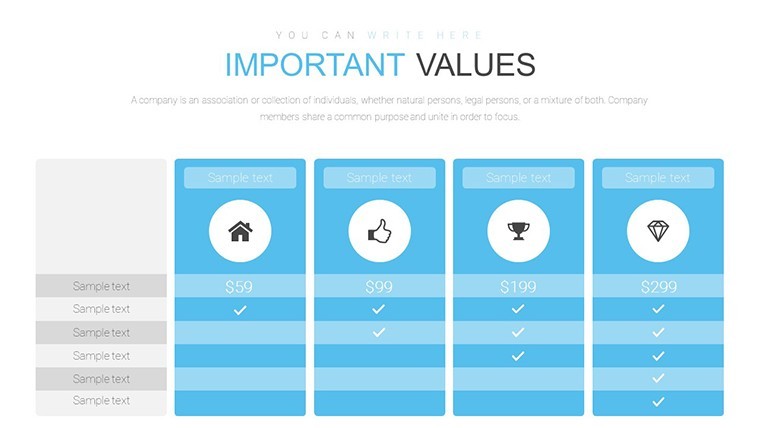
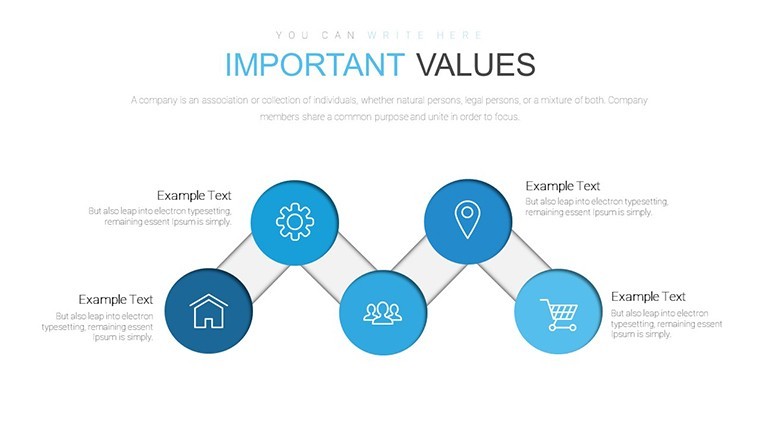
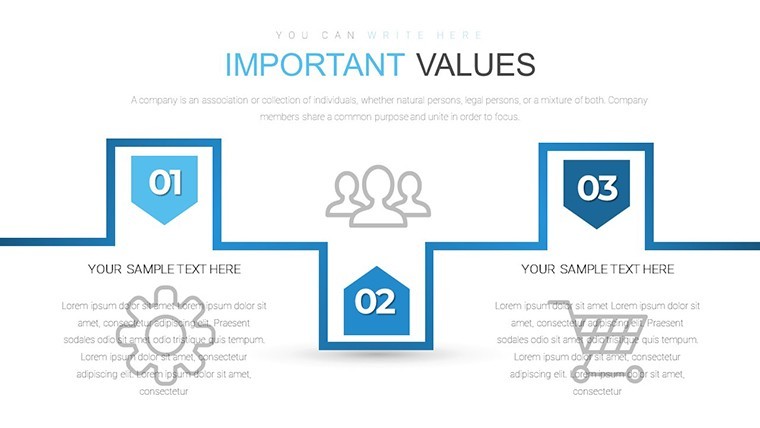
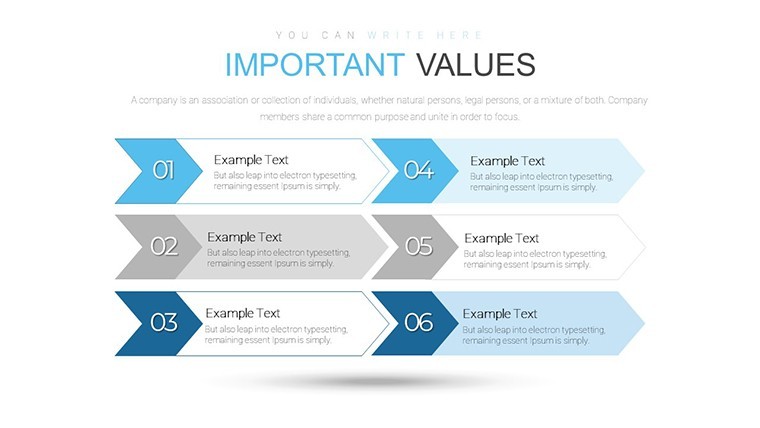
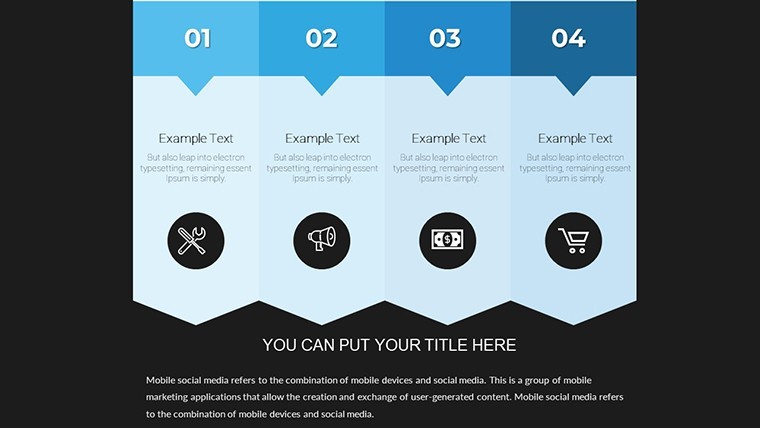
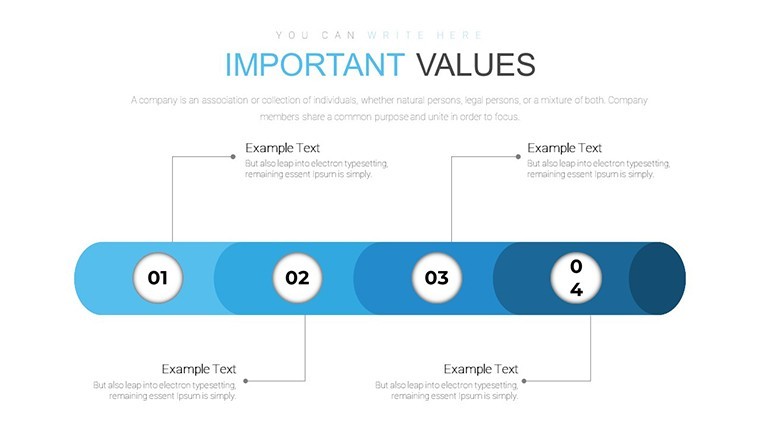
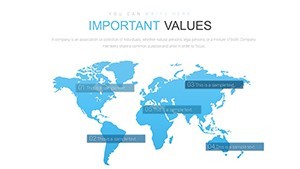
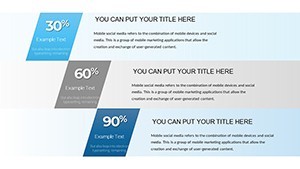
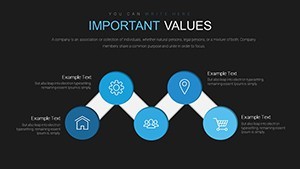
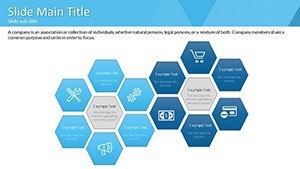
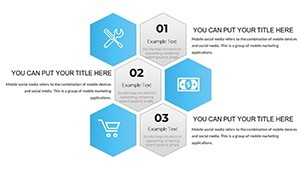
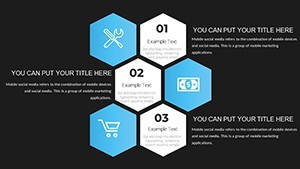
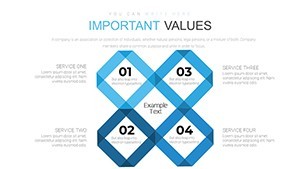
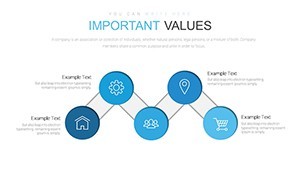
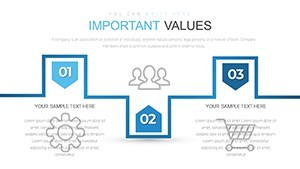
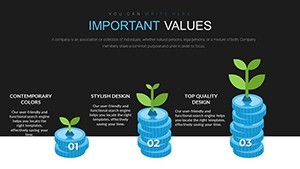
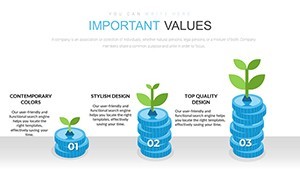
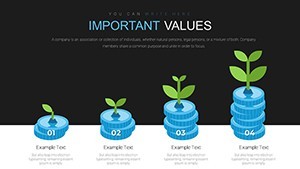
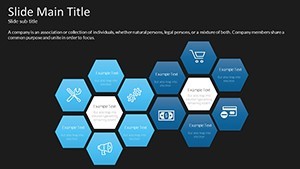
- Infographic Elements: Icons and layouts for representing cloud architectures, such as layered diagrams for stack overviews.
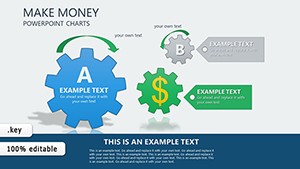
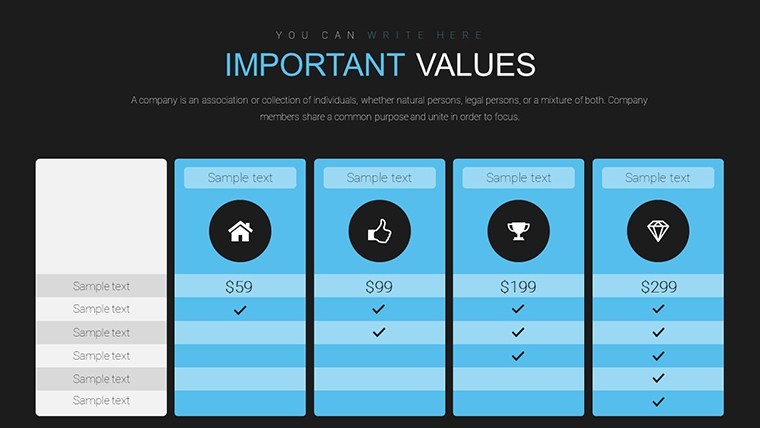
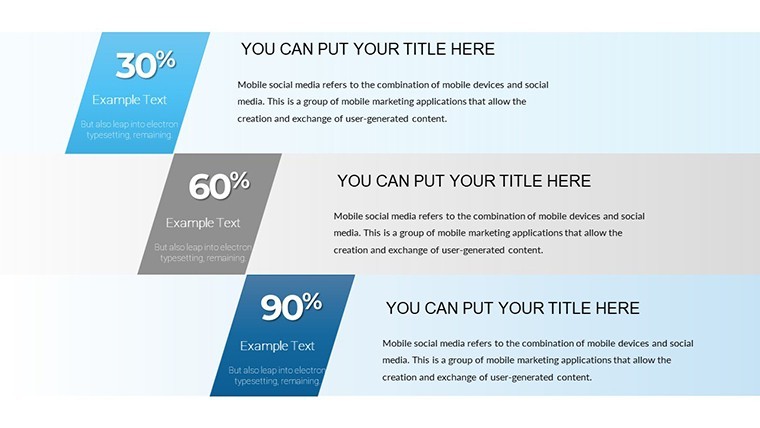
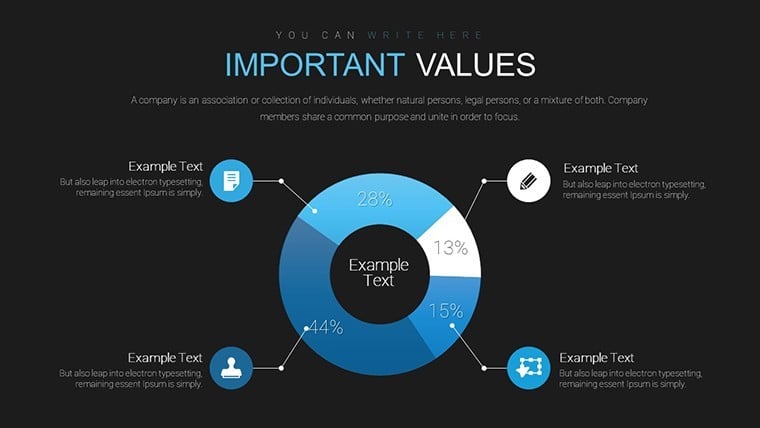
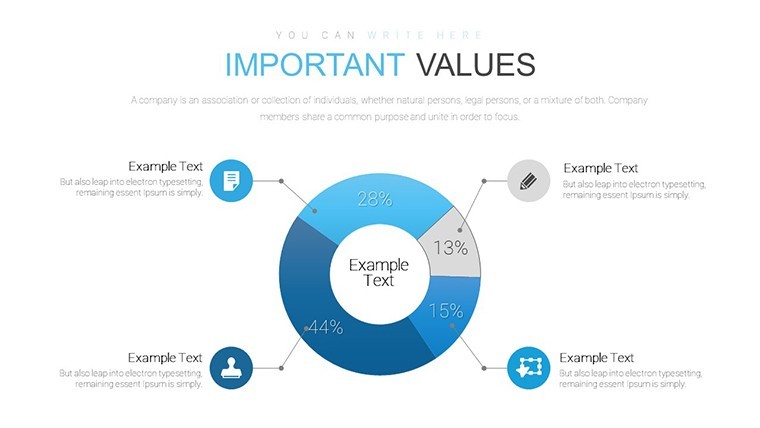
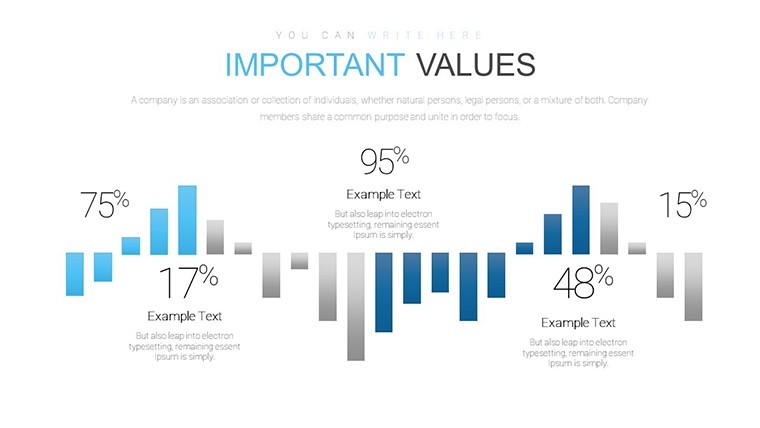
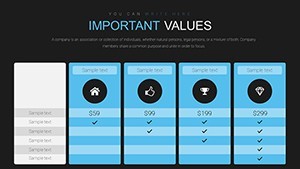
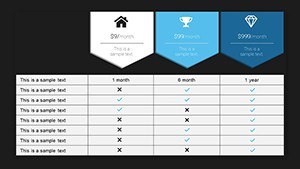
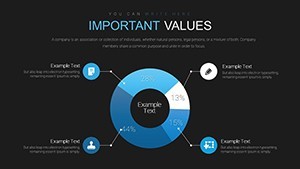
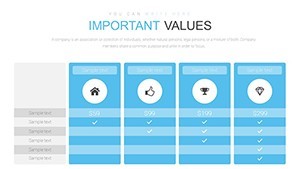
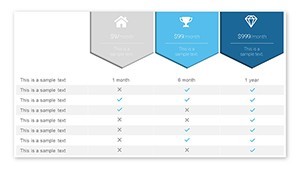
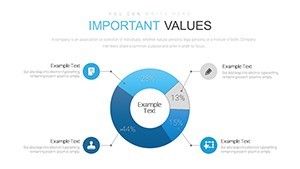
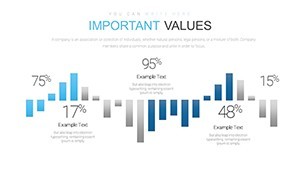
- Charts and Graphs: Bar, pie, line charts optimized for metrics like uptime percentages or bandwidth usage.
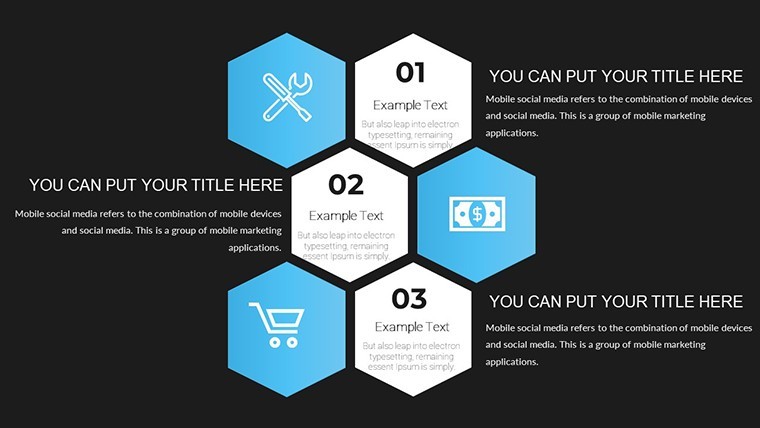
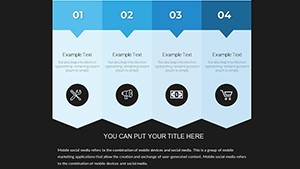
- Customization Options: Alter colors to match cloud provider branding (e.g., AWS blue, Azure teal), fonts for readability, and layouts for content flow.
- Drag-and-Drop Functionality: Quickly rearrange elements, ideal for iterative design in fast-paced environments.
- Compatibility: Seamless with Keynote, supporting animations for dynamic reveals.
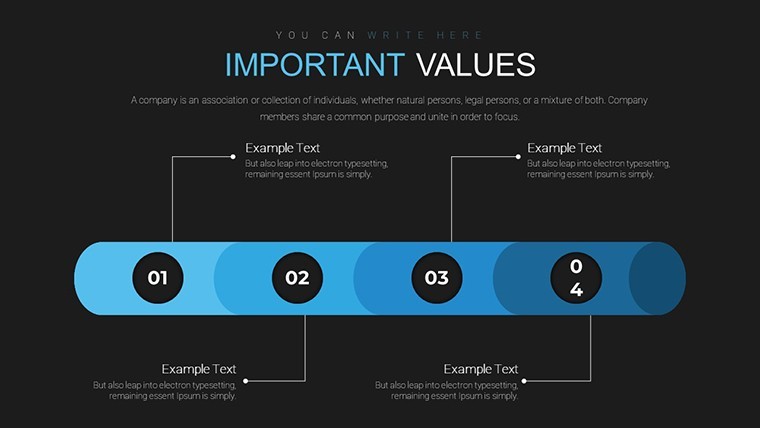
Compared to basic Keynote tools, this template offers pre-themed cohesion, saving time while elevating polish. For example, use the infographic slides to depict data migration paths, incorporating timelines that align with ITIL best practices for change management.
Targeted Use Cases in Cloud Environments
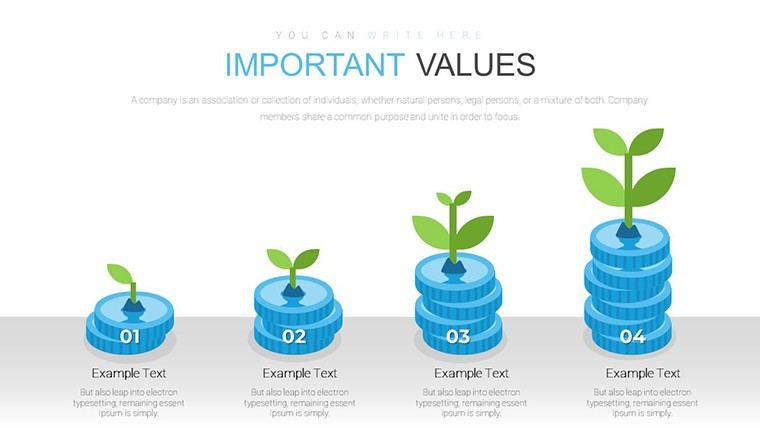
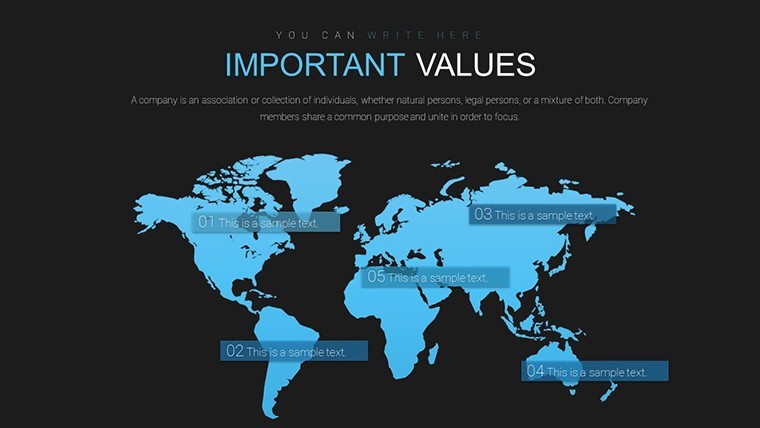
Tailored for professionals, this template shines in various applications. Sales executives can leverage market trend charts to forecast cloud growth, citing sources like IDC's predictions of $1 trillion in cloud spending by 2025. Marketing managers might use infographics to highlight service differentiators, such as zero-downtime features in resilience planning.
In project teams, update slides facilitate status reports on cloud integrations, with Gantt-like charts tracking milestones. Real case: A tech firm used similar visuals to secure funding by clearly showing ROI on cloud investments, boosting investor confidence. Educators in cloud certification courses can adapt slides for tutorials on virtualization, enhancing learner comprehension through visual aids.
Benefits That Propel Your Cloud Communications
Beyond features, the benefits are transformative. Captivate audiences with visuals that simplify complexity - turning jargon-heavy topics like container orchestration into accessible diagrams. This builds authoritativeness, as per principles, by presenting data-backed insights.
Save precious time: What might take hours in custom design is minutes here. Gain a competitive edge in proposals, where polished slides differentiate your pitch. For instance, in a vendor evaluation, use comparison charts to weigh cloud providers, fostering informed decisions.
Expert Tips for Optimal Use
- Align with audience needs: Choose charts that match technical depth - simple for execs, detailed for engineers.
- Incorporate real data: Pull from tools like AWS Cost Explorer for authenticity.
- Enhance with animations: Fade-ins for layered cloud stacks to build understanding step-by-step.
- Ensure accessibility: Use high-contrast colors and alt text for inclusivity.
- Iterate collaboratively: Share via Keynote's collaboration features for team input.
Integrate into workflows by linking with cloud tools - export to PDF for sharing on platforms like SharePoint or Google Drive.
Unlock Cloud Presentation Excellence Now
Don't let your cloud stories get lost in translation. Download our Cloud Services Keynote charts template and start creating presentations that inform, inspire, and influence. Elevate your professional edge with visuals that speak volumes - get started today.
FAQ
What makes this template ideal for cloud services?
It includes themed infographics and charts specifically for cloud metrics and architectures.
How customizable are the slides?
Fully - edit colors, fonts, layouts, and add your data with ease.
Is it only for Keynote?
Yes, optimized for Keynote, but convertible to other formats if needed.
Can it handle complex data?
Absolutely, with graphs designed for multi-layered cloud insights.
Who should use this template?
IT pros, sales teams, and managers in cloud-related fields.
How does it compare to free alternatives?
Offers professional designs and time-saving features not found in basics.