8 Door Charts in Keynote - Fully Editable | ImagineLayout

Type: Keynote Charts template
Category: Relationship, Illustrations
Sources Available: .key
Product ID: KC00656
Template incl.: 8 editable slides
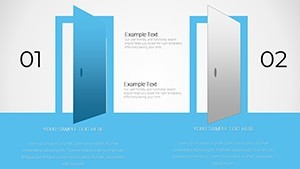
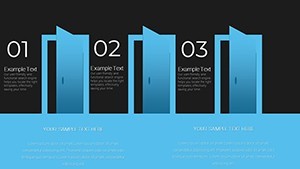
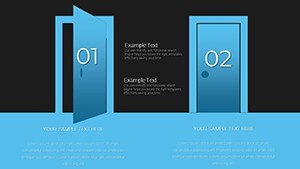
Commercial Doors Charts Keynote Template
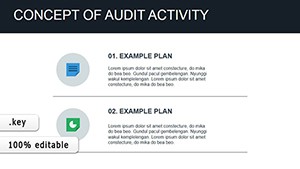
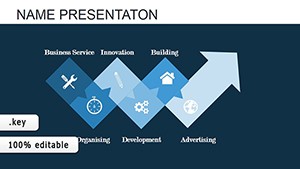
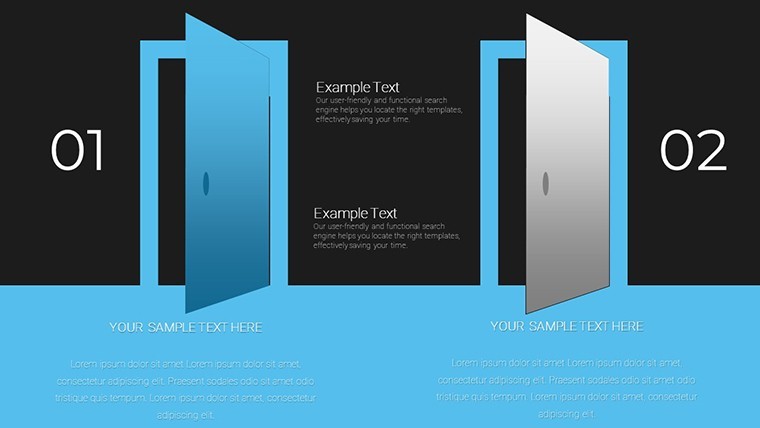
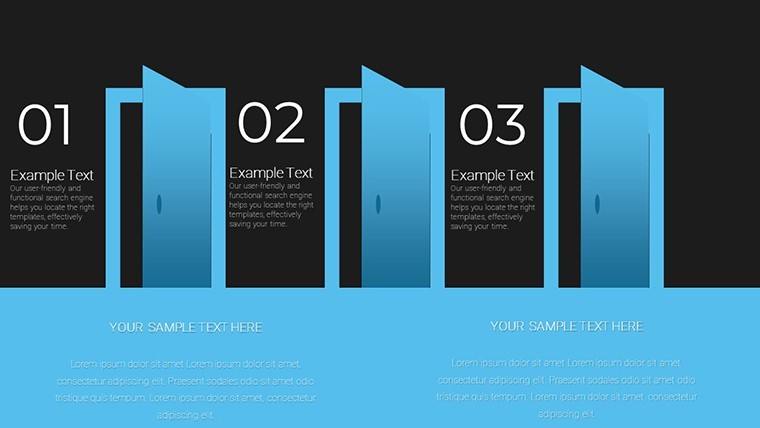
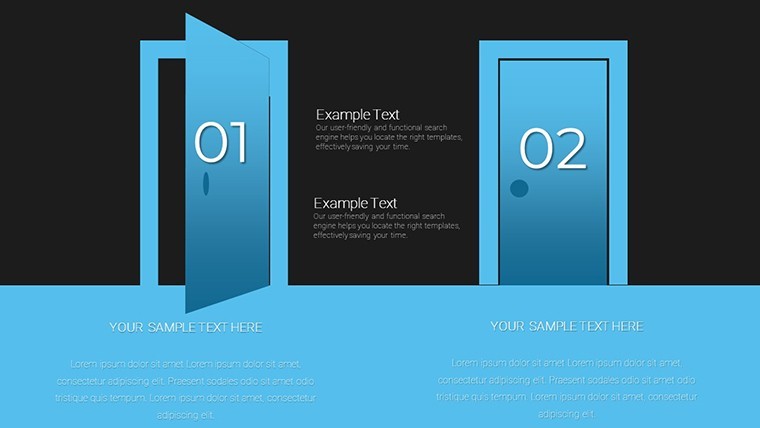
Eight charts cover door comparisons and project timelines.
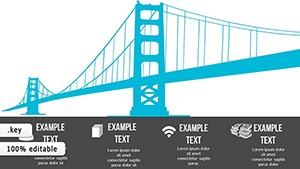
When you need to present commercial door specifications to stakeholders the horizontal comparison layouts place material fire rating and acoustic performance side by side without manual alignment.
No setup needed.
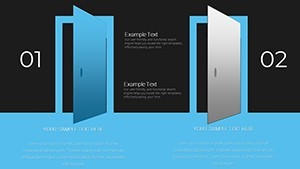
In most cases you only replace text and adjust colors yet the structure stays intact across all eight slides.
The paid version includes eight editable slides in KEY format while free version details remain unspecified on the page.
Typically teams reuse the same diagram across multiple project bids instead of building diagrams manually.
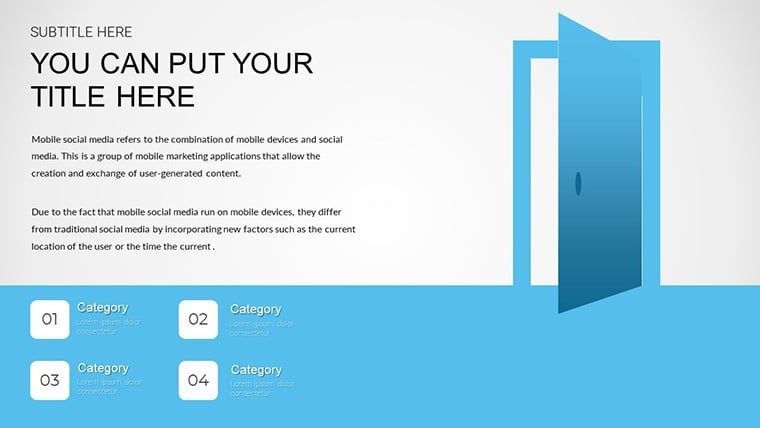
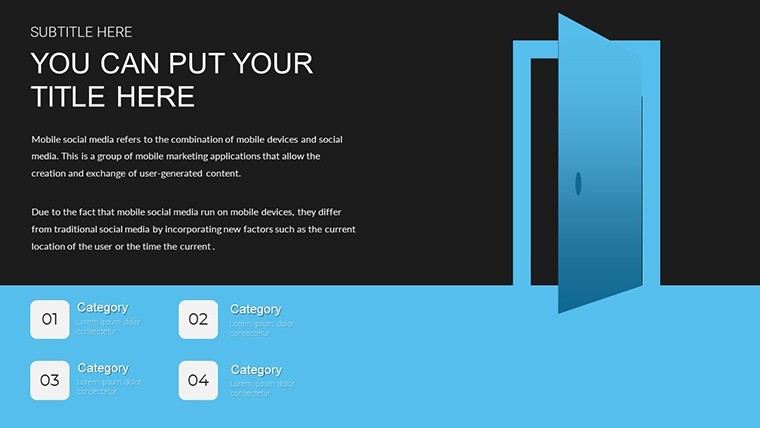
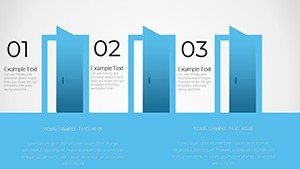
This Keynote chart template organizes relationship maps and value visuals so construction project managers can compare door types and decide on the best system for safety cost and durability.
You drop in your data and it works.
Use this when you need to show multi-variable comparisons without arranging shapes manually.
The predefined structure keeps everything aligned so you don`t end up adjusting spacing slide by slide.
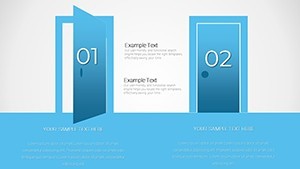
It supports comparison analysis and helps identify which door option best fits the building requirements.
After viewing the charts the viewer can conclude the optimal specification for the tender.
Works best for structured diagrams not creative storytelling slides.
Not ideal for data-heavy dashboards where dozens of metrics crowd each visual.
| Feature | Details |
|---|---|
| Slides / diagrams | 8 charts with relationship maps comparisons process timelines and value visuals |
| File format | .KEY |
| Software version | Keynote 12+ standard for current KEY files |
| Color schemes | Adjustable via slide master for instant palette switch |
| Editable elements | Shapes text tables and icons resize and recolor independently |
| Aspect ratio | 16:9 widescreen |
| Free vs Paid | Paid version includes full 8 editable slides |
| Masters / Backgrounds | Editable masters for quick updates across the deck |
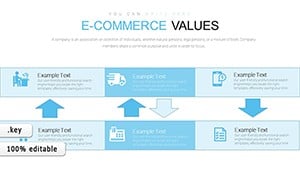
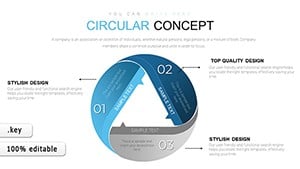
See also E-commerce Value Keynote Charts or Circular Concept Keynote Chart.
What is the Keynote version compatibility and macOS requirement?
The template works with Keynote 12 and later on macOS Ventura or newer. In practice test on your version first to ensure full compatibility with vector elements. Current installations handle the files without conversion.
How do I change colors via slide master?
Open the slide master view in Keynote select the master slide and update the color palette there. This applies changes across all eight slides instantly. No need to edit each chart individually.
Does the license allow client work?
Yes the license permits use in client projects once purchased. You can deliver the edited decks to clients without additional fees. Always retain the original file for your records.
What is the difference between free and paid versions?
The paid version includes the complete set of 8 editable slides. Free version details are not specified on the page but the paid one provides full access to all charts and structures.
What are the refund conditions?
Refunds are available within 14 days if the template does not meet your needs. Contact support with your purchase details for processing. Note that digital downloads have strict policies after opening the file.
Everything is already structured.
Download and start editing immediately