Speedometer Values Keynote Charts - Editable Keynote | ImagineLayout


Type: Keynote Charts template
Category: Pie
Sources Available: .key
Product ID: KC00633
Template incl.: 16 editable slides
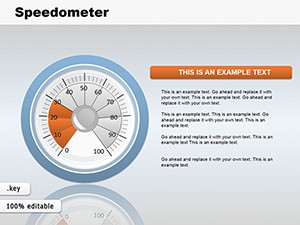
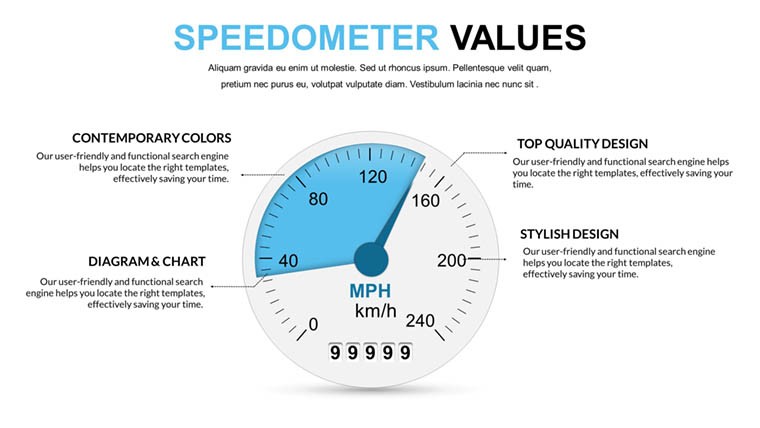
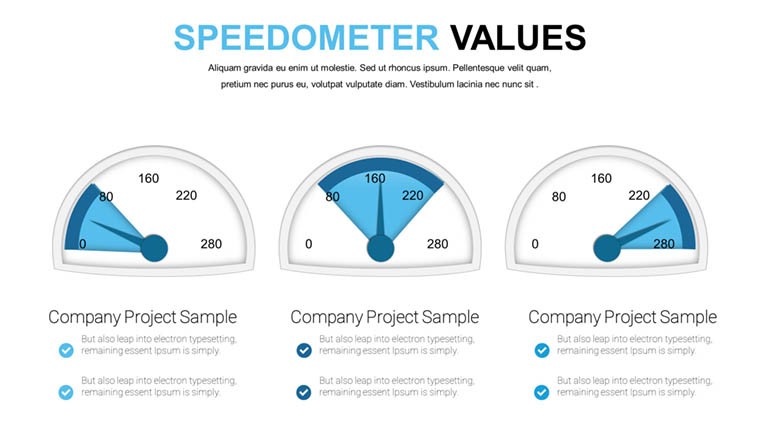
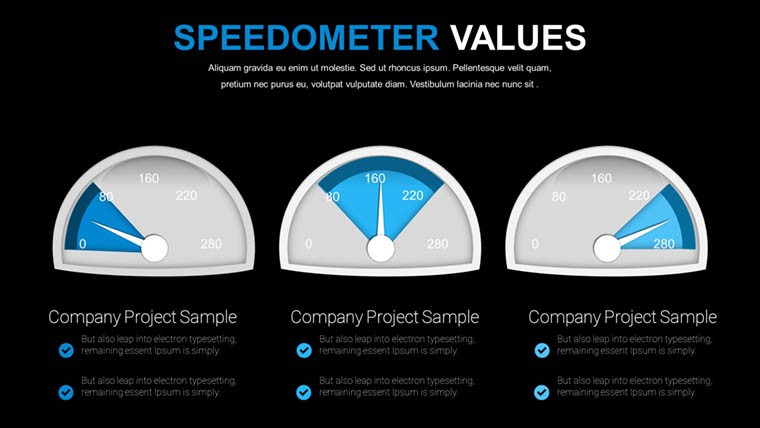
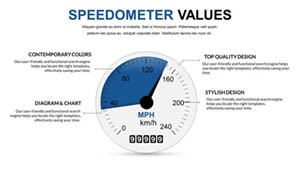
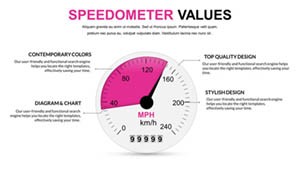
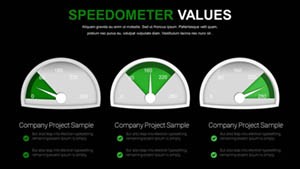
Speedometer Values Keynote Charts: Accelerate Your Data Storytelling
What's inside the 16-slide set? Speedometer gauges ready for KPI tracking in Keynote.
Everything is already structured.
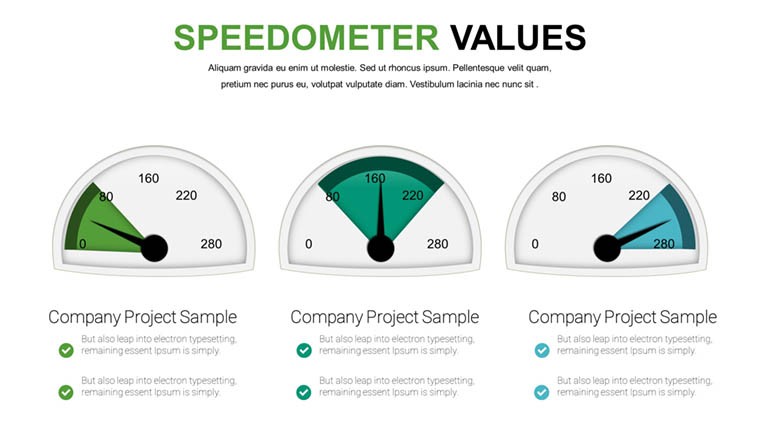
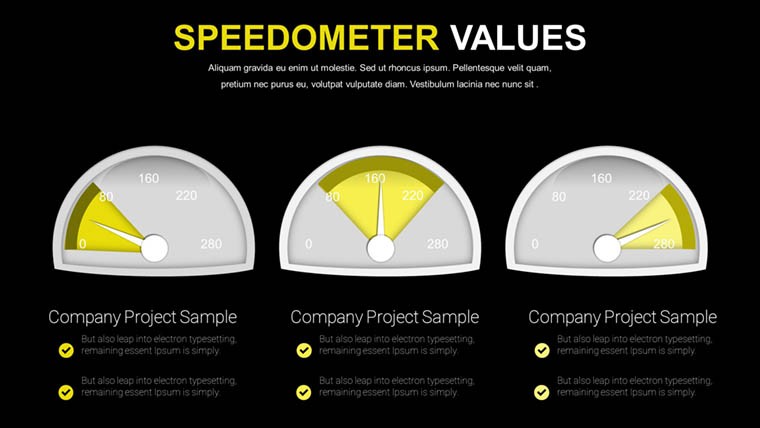
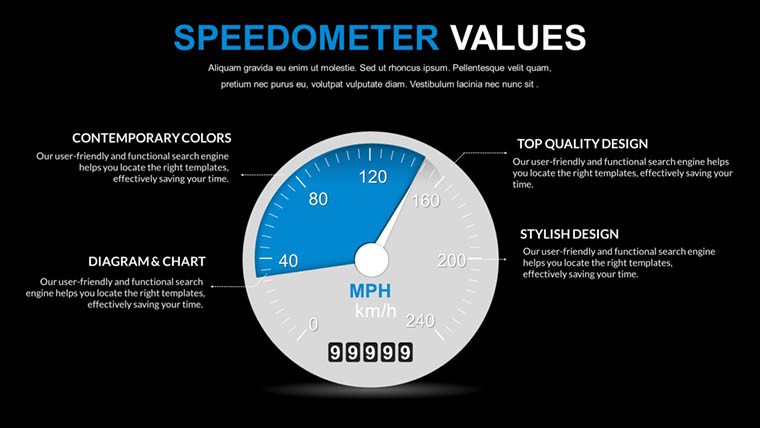
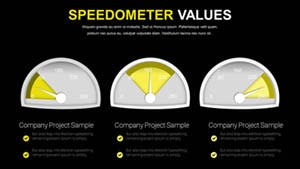
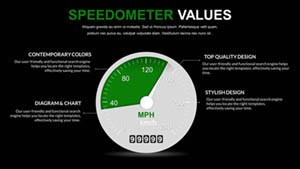
When you need to communicate performance metrics to executives the gauge layouts organize current values versus targets so viewers grasp status without extra explanation.
You drop in your data and it works.
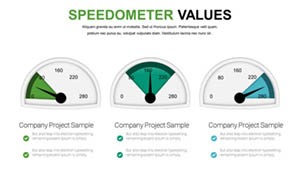
The speedometer gauges form a Keynote chart template that represents KPI analysis where input data like actuals and goals goes into each dial and the viewer decides on performance actions.
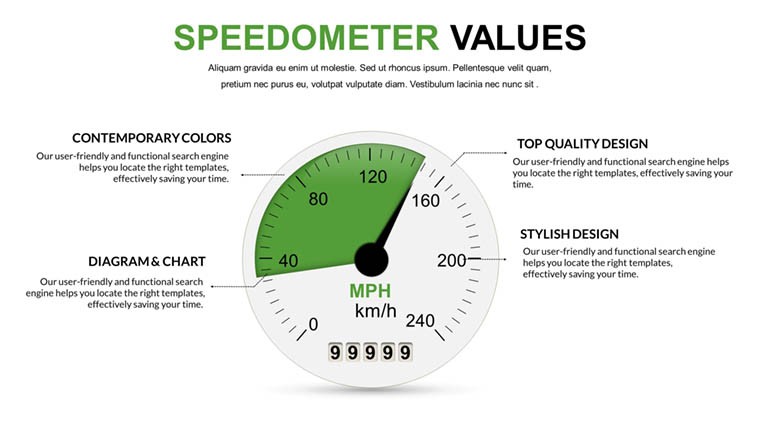
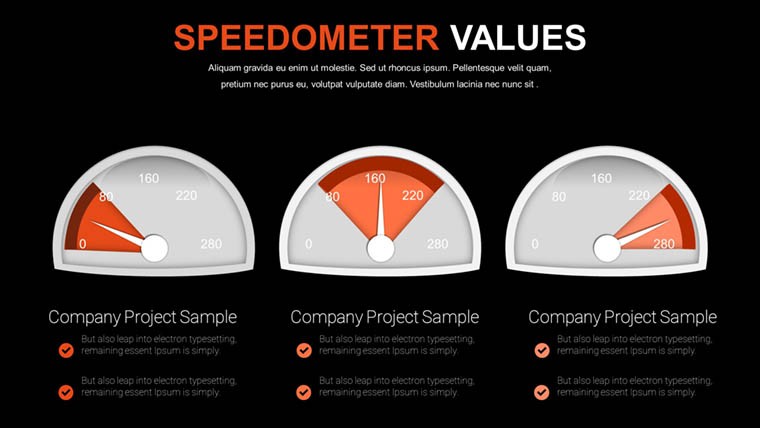
Operations leads use this paid file for dashboard summaries and in most cases they only replace the needle positions.
This suits executives reviewing indicators yet it is not ideal for narrative storytelling slides.
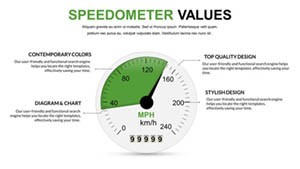
Use this instead of building gauges manually in Keynote.
The predefined structure keeps everything aligned so you don't end up adjusting spacing slide by slide and the result stays readable on one slide.
Typically teams reuse the same diagram across monthly reviews.
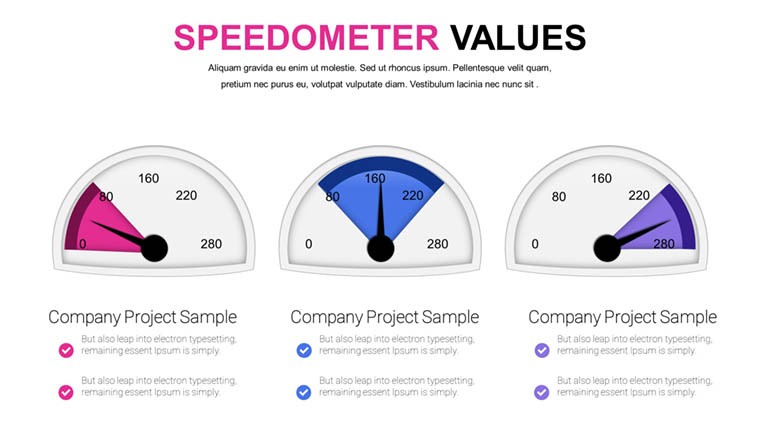
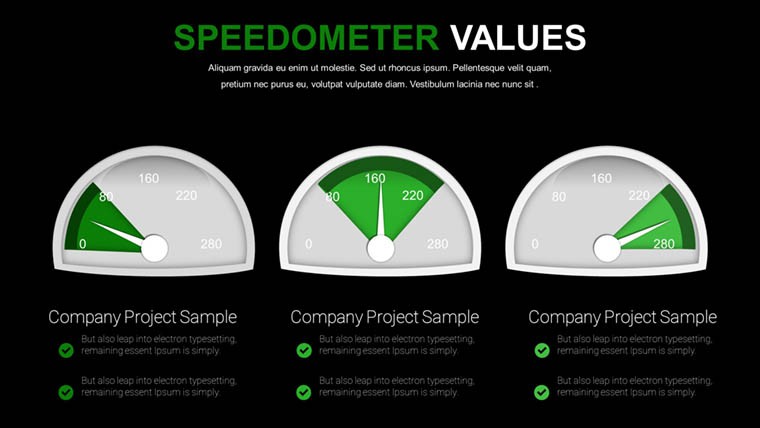
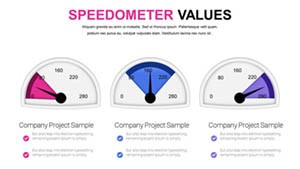
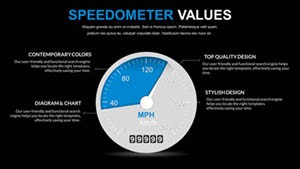
The file works across multiple reports while color changes happen via slide master in under a minute.
Instead of building from scratch you get the gauges ready for immediate editing.
Color schemes are not listed on the page but the vibrant zones remain compatible with current Keynote installations.
Best used when your metrics fit the gauge format only.
Specifications
| Feature | Details |
|---|---|
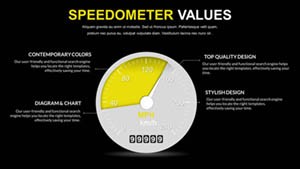
| Slides / diagrams | 16 speedometer gauges |
| File format | KEY |
| Software version | Keynote 12+ |
| Color schemes | Vibrant zones updated via master |
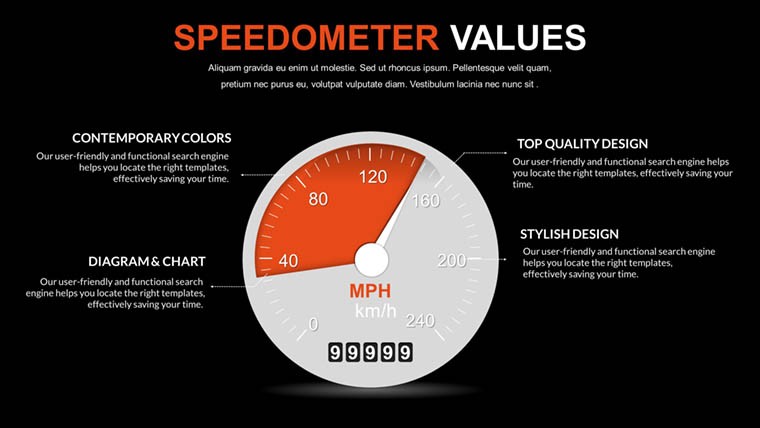
| Editable elements | Needles and values resize independently |
| Aspect ratio | 16:9 |
| Free vs Paid | Paid includes the full 16 editable slides |
| Masters / Backgrounds | Slide master for quick palette switch |
Discover related pie options in the pie category or the speedometer charts template.
How do I change colors via the slide master?
The colors update via the slide master. Open the master view in Keynote select the background or accent colors and the changes apply to every diagram element automatically. Typically this keeps your deck consistent when switching between reports without manual adjustments on each slide.
Does the license allow client work?
The license permits client work provided you do not resell the original template files. You can deliver the finished presentation to your clients with no extra fees. Source files stay protected under the single-user terms.
What is the difference between free and paid?
The paid version delivers the complete editable slide set. Free options on the site provide fewer slides for initial testing. In practice the paid file saves time by including all variations without restrictions.
What are the refund conditions?
Refunds are possible within 14 days of purchase if the template does not match your Keynote setup. Provide your order number and a brief reason to support. This applies only if the file has not been used in any project.
Multiple team members - one license?
One license is for a single user only. Team members need individual licenses to comply with terms. Volume options exist for larger groups via support contact.
You open the file and start editing.
Download and start editing immediately