00% off everything!
SALE ENDS TODAY, Saturday November 0
Promo code "00LAYOUTS"
Time Left to Save
00:00:00

Technical Analysis Financial Markets Keynote Template: Decoding Chart Chronicles

4
563 ratings
Technical Analysis Financial Markets Keynote Template: Decoding Chart Chronicles - Slide #1
28 Diagrams (7 Color Schemes)
  • Diagram page 1 - Technical Analysis Financial Markets Keynote Template: Decoding Chart Chronicles
  • Diagram page 2 - Technical Analysis Financial Markets Keynote Template: Decoding Chart Chronicles
  • Diagram page 3 - Technical Analysis Financial Markets Keynote Template: Decoding Chart Chronicles
  • Diagram page 4 - Technical Analysis Financial Markets Keynote Template: Decoding Chart Chronicles
  • Diagram page 5 - Technical Analysis Financial Markets Keynote Template: Decoding Chart Chronicles
  • Diagram page 6 - Technical Analysis Financial Markets Keynote Template: Decoding Chart Chronicles
  • Diagram page 7 - Technical Analysis Financial Markets Keynote Template: Decoding Chart Chronicles
  • Diagram page 8 - Technical Analysis Financial Markets Keynote Template: Decoding Chart Chronicles
  • Diagram page 9 - Technical Analysis Financial Markets Keynote Template: Decoding Chart Chronicles
  • Diagram page 10 - Technical Analysis Financial Markets Keynote Template: Decoding Chart Chronicles
  • Diagram page 11 - Technical Analysis Financial Markets Keynote Template: Decoding Chart Chronicles
  • Diagram page 12 - Technical Analysis Financial Markets Keynote Template: Decoding Chart Chronicles
  • Diagram page 13 - Technical Analysis Financial Markets Keynote Template: Decoding Chart Chronicles
  • Diagram page 14 - Technical Analysis Financial Markets Keynote Template: Decoding Chart Chronicles
  • Diagram page 15 - Technical Analysis Financial Markets Keynote Template: Decoding Chart Chronicles
  • Diagram page 16 - Technical Analysis Financial Markets Keynote Template: Decoding Chart Chronicles
  • Diagram page 17 - Technical Analysis Financial Markets Keynote Template: Decoding Chart Chronicles
  • Diagram page 18 - Technical Analysis Financial Markets Keynote Template: Decoding Chart Chronicles
  • Diagram page 19 - Technical Analysis Financial Markets Keynote Template: Decoding Chart Chronicles
  • Diagram page 20 - Technical Analysis Financial Markets Keynote Template: Decoding Chart Chronicles
  • Diagram page 21 - Technical Analysis Financial Markets Keynote Template: Decoding Chart Chronicles
  • Diagram page 22 - Technical Analysis Financial Markets Keynote Template: Decoding Chart Chronicles
  • Diagram page 23 - Technical Analysis Financial Markets Keynote Template: Decoding Chart Chronicles
  • Diagram page 24 - Technical Analysis Financial Markets Keynote Template: Decoding Chart Chronicles
  • Diagram page 25 - Technical Analysis Financial Markets Keynote Template: Decoding Chart Chronicles
  • Diagram page 26 - Technical Analysis Financial Markets Keynote Template: Decoding Chart Chronicles
  • Diagram page 27 - Technical Analysis Financial Markets Keynote Template: Decoding Chart Chronicles
  • Diagram page 28 - Technical Analysis Financial Markets Keynote Template: Decoding Chart Chronicles

Type: Keynote Themes

Category: Finance - Accounting

Sources Available: .jpg, .key, .kth

Product ID: KT01473

Purchase this template
Template incl.:
3 Masters,
3 Backgrounds
$12.00
Template incl.:
3 Masters,
3 Backgrounds,
28 Diagrams,
7 color schemes for diagrams
$27.00

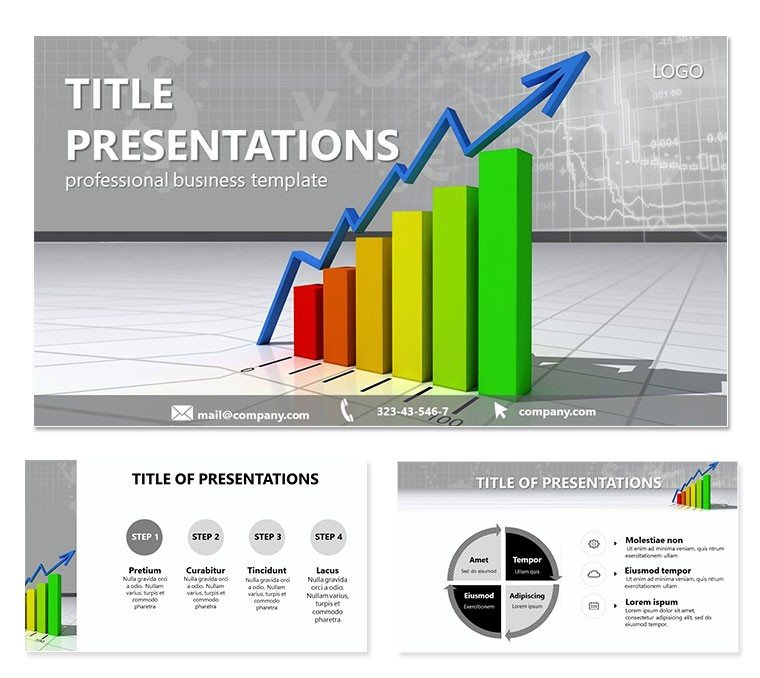
Stare at candlesticks like tea leaves, patterns whispering tomorrow`s tale - that interpretive insight anchors the Technical Analysis Financial Markets Keynote template, a seer`s scroll for analysts, quants, and floor fighters. Laden with 28 pattern diagrams in 3 master charts and 3 ticker-tape backgrounds, illuminated by 7 color schemes from bullish greens to bearish crimsons, it patterns predictions with poise.

For strategy sessions or signal scans, head-and-shoulders highs crest warnings, moving average merges signal shifts, charting courses through market memories.

Patterned Peaks in Power

Masters parse trends, indicators, and forecasts, fusing with backgrounds of grid graphs or wave wires.

  • 28 Tech Diagrams: Candles, flags, fib retraces, flexible for frame fits.
  • Seven Signal Shades: Codes for candor - uptrends in azure, downs in dusk.
  • Trendline Tools: Pivot points and oscillator orbs for overlay oracles.

A quant might merge MAs, lines converging to confirm calls.

Charting Courses Through Cases

For a bull briefing: Candle from doji doubts to engulfing ends, fibs framing fallbacks.

  1. Tick Tape In: Import OHLC; auto-plot patterns.
  2. Signal Stack: Layer lags for confluence confirms.
  3. Forecast Flash: Animate arcs to apex anticipations.

Traders trace triangles in reviews, tightening to breakout bets.

Outpacing Plain Plots

Leap lagging lines with pre-patterned precision. Tie to TradingView for live layers.

Syncing Strategy Sessions

Keynote crunches charts crisply, Slack shares for squad scans.

Hedge funds histogram histories, analysis arcs archiving anomalies.

Trade on Technicals

Harness the Technical Analysis Financial Markets Keynote template for $22 and pattern your prowess. Download to divine directions.

Frequently Asked Questions

What patterns are pre-built?

From wedges to RSI divergences, core classics covered.

Data import from platforms?

CSV clips or API embeds for fluid feeds.

Custom indicators?

Add via shapes, scaling to spec.

For stocks or forex?

Universal - adapt axes for assets.

Animation for trends?

Line grows and fills for forward feels.

Export for reports?

PDF preserves patterns perfectly.