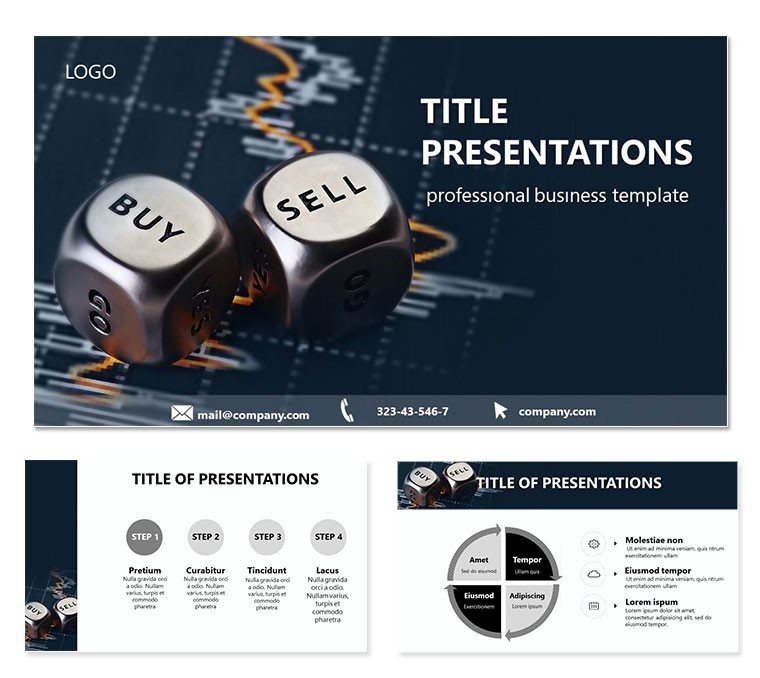
Imagine stepping into a high-stakes investor meeting where every slide turns heads and sparks questions that lead to deals. That`s the power of the Buy and Sell Currencies Keynote Template, designed specifically for forex traders, financial advisors, and market analysts who need to demystify currency exchanges without overwhelming their audience. This isn`t just a set of slides - it`s a toolkit that transforms raw market data into compelling stories about opportunities in buying and selling currencies. With 28 meticulously crafted diagrams, three master layouts, and seven versatile color schemes, you get the flexibility to tailor every presentation to your brand`s voice, whether you`re pitching to novice investors or seasoned executives.
What sets this template apart is its focus on clarity amid the chaos of forex markets. Picture a slide that breaks down pip movements with a clean line graph, or another that visualizes cross-currency pairs through intuitive icons - no more fumbling with clunky default Keynote tools that leave your data looking flat. Built for Keynote users on Mac, it`s compatible from 2016 onward, ensuring smooth animations and transitions that keep eyes glued to the screen. Whether you`re explaining the basics of spot trading or diving into advanced hedging techniques, these slides make it effortless to build trust and drive decisions.
Unlocking Key Features for Seamless Currency Insights
Dive deeper into what makes this template a go-to for forex professionals. Start with the three master slides: one for a sleek title sequence that sets a professional tone with subtle currency motifs, another for content-heavy sections featuring balanced text and visual pairings, and a third for data-driven closers that reinforce your call to action. Each master integrates seamlessly with Keynote`s build-in features, like hyperlinks for quick navigation to detailed appendices on exchange rates.
The real magic happens in the 28 diagrams. For instance, Diagram 1 introduces the global forex landscape with a world map overlay highlighting major trading hubs - perfect for opening your pitch on interconnected markets. Move to Diagram 5, a customizable bar chart for comparing buy-sell spreads across pairs like EUR/USD and GBP/JPY; simply drag in your latest data, and the template auto-adjusts scales for precision. Or consider Diagram 12, an interactive timeline that traces currency fluctuations over quarters, helping you illustrate trends without manual redraws every update.
- Visual Storytelling Tools: Embedded icons of coins, charts, and arrows that animate on click, turning static info into dynamic narratives.
- Customization Ease: All elements are vector-based, so resizing or recoloring with your firm`s palette takes seconds - no pixelation worries.
- Mobile-Ready Outputs: Export to PDF or video for sharing post-meeting, maintaining crisp quality on any device.
These features aren`t just bells and whistles; they`re crafted to address common pain points, like condensing volatile market reports into digestible bites. A financial consultant might use Diagram 18`s pie chart to allocate risk across portfolios, making abstract concepts tangible and actionable.
Step-by-Step: Building Your First Forex Pitch
- Gather Your Data: Pull recent exchange rates from reliable sources - the template`s placeholders guide you on where to slot in figures for buy volumes versus sell pressures.
- Customize Layouts: Select a color scheme - say, cool blues for stability themes - and apply it across masters to unify your deck.
- Add Interactivity: Link Diagram 22`s flowchart to a hidden slide with swap contract details, revealing layers as you progress through your talk.
- Rehearse and Refine: Use Keynote`s presenter notes integrated into each slide to jot reminders, like "Pause here to field questions on leverage risks."
- Present with Confidence: Hit play, and watch as smooth fades between currency pair comparisons keep momentum high.
This workflow shaves hours off prep time compared to starting from scratch in a blank Keynote file, letting you focus on strategy rather than styling.
Real-World Applications: From Trading Floors to Boardrooms
Forex isn`t one-size-fits-all, and neither is this template. For a hedge fund manager outlining quarterly strategies, leverage Diagram 7`s scatter plot to plot volatility against yield - a visual that echoes techniques used in professional decks for clarity under pressure. An educational webinar host could repurpose Diagram 15`s infographic on major vs. exotic pairs to engage retail traders, fostering discussions that build long-term client relationships.
In client consultations, swap out generic bullet points for Diagram 25`s radial diagram, which radiates buy opportunities from a central currency node, making it easy to spotlight undervalued assets. Even in regulatory compliance reviews, the template`s neutral backgrounds ensure your message stands out without distracting flair. Think of it as your silent partner: reliable, adaptable, and always ready to elevate the conversation around currency dynamics.
Comparing to Basic Keynote Defaults
Why bother with defaults when they force you into rigid grids? This template`s responsive grids adapt to your content, unlike stock charts that require constant tweaking. Where plain slides might bury key insights in text walls, here every diagram prioritizes scannability - larger fonts for mobile viewing, balanced whitespaces that guide the eye. It`s like upgrading from a bicycle to a sports car for your presentations: faster, smoother, and far more exhilarating.
Integrate it into your routine by pairing with tools like Excel exports; the diagrams accept pasted tables that auto-format into polished visuals. For teams, share the .key file via cloud, and collaborators can tweak without version conflicts - ideal for iterative forex forecasts.
Enhance Engagement with Themed Icons and Tips
Sprinkled throughout are over 50 themed icons - from upward arrows for bullish trends to shield symbols for risk mitigation - all editable to match your narrative. A pro tip: Layer icons over photos of global exchanges in Diagram 3 to add depth, creating a sense of place that resonates with international audiences.
To maximize impact, align your color choices with market sentiments: greens for growth phases in buy-focused slides, reds for caution in sell analyses. This subtle psychology, drawn from presentation best practices, ensures your deck not only informs but persuades.
Ready to turn market noise into signal? Download the Buy and Sell Currencies Keynote Template now for $22 and start crafting pitches that close.
Frequently Asked Questions
Is this template compatible with older Keynote versions?
Yes, it works seamlessly with Keynote 2016 and later, including the latest macOS updates.
How many color schemes are included?
There are seven distinct color schemes, each optimized for diagrams to suit various branding needs.
Can I use it for commercial forex training?
Absolutely, it`s licensed for both personal and professional use in educational or business settings.
Does it include animations?
Yes, built-in Keynote animations enhance transitions, with options to customize or remove them easily.
Are the diagrams fully editable?
Every diagram is vector-based and fully customizable, from shapes to data inputs.