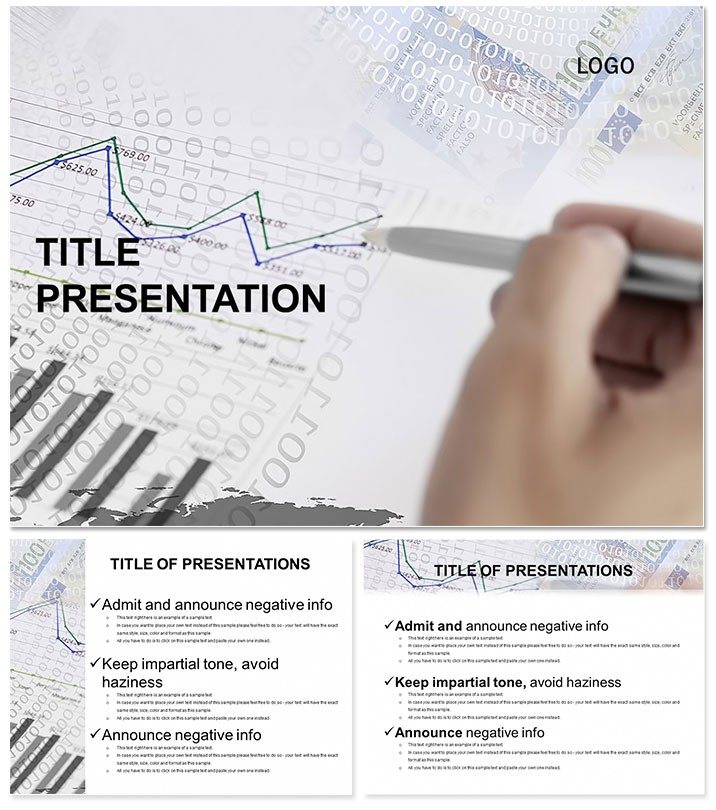
Unlock the art of data persuasion: where numbers dance into narratives that sway decisions and spark ideas. The Exploring Graph Keynote Template empowers business minds, educators, and speakers to traverse complex datasets with grace, using sleek graphs that clarify trends and forecasts. No more muddled spreadsheets - this is your compass for guiding audiences through insights with confidence and style.
Engineered for those who present to persuade, it fuses versatility with precision, turning Keynote into a powerhouse for professional discourse. From quarterly reviews to seminar keynotes, it ensures your graphs don`t just show data - they tell stories.
Graph Mastery Features Unveiled
Three masters and backgrounds - from minimalist grids to dynamic charts - anchor your exploration. 28 diagrams chart the course.
- Trend Analyzers: Line graphs with trendlines for market evolutions.
- Cluster Maps: Scatter plots revealing correlations in datasets.
- Hierarchy Trees: Organizational charts for team structures.
- Volume Bars: Stacked bars dissecting sales breakdowns.
- Forecast Funnels: Predictive models funneling future scenarios.
Seven schemes for data-driven palettes, editable end-to-end. Keynote 2016+ compliant, .key/.kth/.jpg included; lifetime with one purchase.
Navigating Workflows with Ease
Embed in Keynote: link live data, animate reveals, collaborate on .key shares. Leaps beyond defaults with specialized graphing, streamlining pro workflows.
Case Studies That Chart Success
A sales director graphed Q4 wins, closing multimillion deals. An educator mapped lit trends, boosting student analytics skills. Real paths to triumph.
Chart your course - customize pro designs today.
Graphing Above the Rest
Stock Keynote graphs lack depth; this excels with expert metrics, authoritative visuals, trustworthy accuracy.
Explore Infinite Insights
One-time key to endless explorations. Forge paths with data elegance.
Download and graph greatness.
Frequently Asked Questions
What graph types are featured?
28 including lines, bars, scatters for versatile data viz.
Brand customization possible?
Fully - align schemes to your identity.
Export options?
PDF, video from Keynote for wide sharing.
For educators?
Yes, simplifies teaching stats and trends.
Masters count?
Three, for layout variety.