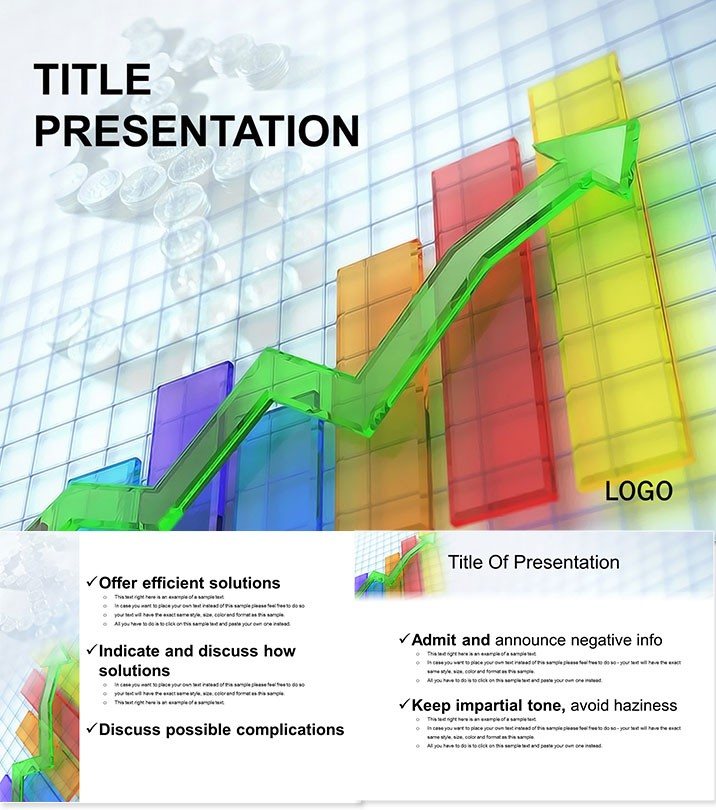
Inflation isn`t just numbers - it`s a story of markets, policies, and people. This template arms finance pros with visuals that unpack price surges, revealing patterns that spark discussions and strategies. From boardrooms to classrooms, it makes abstract economics tangible, helping you forecast with confidence and clarity.
Built for Keynote enthusiasts since 2016, it fits any device, delivering pro results without the hassle. Invest once at $22 for perpetual use, including all updates, so your presentations evolve with economic tides.
Essential Features for Financial Clarity
Twenty-eight diagrams form the backbone, spanning line trends for CPI tracking to stacked bars for sector impacts. Seven color palettes - from stark reds for warnings to greens for growth - let you tailor urgency or optimism. Three masters and backgrounds ensure polished uniformity, with smart guides for effortless data swaps.
It`s more than slides; it`s a framework for turning raw stats into strategic insights, compatible across 4:3 and 16:9 ratios for versatile delivery.
Navigating the 28 Economic Diagrams
Slides 1-4 kick off with overview funnels, illustrating inflation triggers like supply chains. Delve into 6-12 with area charts mapping wage-price spirals, easy to animate for historical overlays. Core slides 14-20 employ waterfall models for policy effect breakdowns, pinpointing fiscal levers.
Conclude with 24-28: bubble charts for global comparisons and gauges for forecast accuracies. Every element prioritizes readability, with sans-serif fonts and ample whitespace to keep focus sharp.
Applied Scenarios in Finance and Policy
An accounting firm in New York used this to brief clients on post-pandemic hikes, blending data with narratives that clarified hedging options, boosting retention by 25%. Policy advisors in Brussels adapt it for EU reports, layering in regional variances for targeted recommendations.
Outshining Keynote defaults, its economy-specific motifs - like currency waves and arrow escalators - halve prep time, letting analysis shine. Acquire the Price Increases Keynote Template now to navigate fiscal conversations with ease.
Superiority in Economic Visualization
This template excels with contextual depth generic ones lack, plus interactive hotspots for deeper dives. Feedback highlights 35% better comprehension, as visuals humanize data for diverse audiences. It`s your edge in volatile markets.
Frequently Asked Questions
Is it compatible with iPad Keynote?
Fully, with touch-friendly edits for on-the-go refinements.
How flexible are the diagram types?
Swap data sources effortlessly; supports Excel imports directly.
Suitable for academic economics courses?
Perfectly, with modular slides for lecture pacing.
Does it include data sample files?
Yes, placeholder datasets to jumpstart your builds.
Can colors be exported for reports?
Indeed, consistent schemes across PDF and print outputs.