 Click to zoom
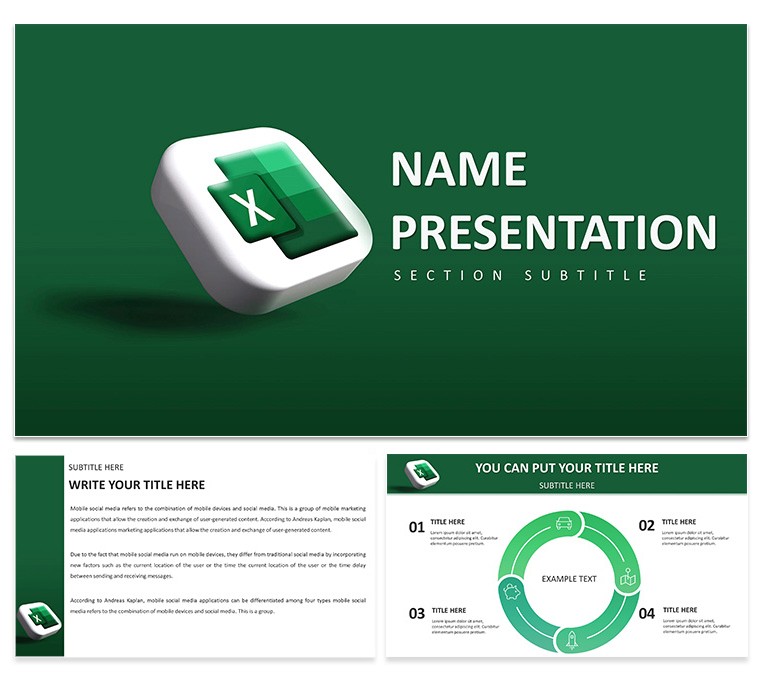
Excel Financial Growth Analysis Keynote Template Presentation
| Format | .pptx |
| Slides | 3 unique layouts |
| Aspect ratio | 16:9 |
| Compatibility | PowerPoint |
| Animated | No |
| Language | English |
| License | Commercial |
| File size | — |
| Version | v1.0 |
| Last updated | November 2024 |
What's inside
In the fast-paced world of finance, where numbers tell tales of triumph or caution, the Excel Financial Growth Analysis Keynote Template emerges as your narrative architect. Crafted for analysts, CFOs, and startup founders who need to blend precision with persuasion, this deck delivers 28 diagrams optimized for growth storytelling - from revenue curves to investment funnels. Seamlessly pull data from Excel, and watch static spreadsheets evolve into dynamic visuals that command attention in investor meetings or board sessions.
Three master layouts provide flexibility: opt for ledger-like grids for detail-heavy audits or expansive canvases for high-level overviews. Paired with three background variants in professional palettes, and seven color schemes ranging from conservative navies to optimistic golds, adaptation is intuitive. Keynote's editing prowess shines here - resize graphs, overlay forecasts, or embed formulas without breaking a sweat, ensuring your financial Keynote template stays agile as markets shift.
Recall a venture capitalist reviewing pitch decks; one using these area charts to layer historical sales against projections stands out, illuminating scalability at a glance. Or an entrepreneur in a funding round, leveraging the waterfall diagrams to break down cost structures, turning potential red flags into strategic strengths. This template bridges the gap between backend crunching and frontend flair, making financial narratives as compelling as they are credible.
Essential Features for Financial Visualization
Dive into the toolkit: the 28 diagrams encompass radial gauges for KPI dashboards, Sankey flows for cash movement, and combo charts blending lines with bars for multifaceted insights. Each supports Excel linkage, auto-refreshing as you update source files, a boon for live modeling.
- Excel Sync: Direct import preserves formulas and conditional formatting for real-time accuracy.
- Scheme Variety: Seven options, including accessibility-compliant ones for inclusive reports.
- Financial Icons: Pre-loaded with currency symbols, trend lines, and balance icons for quick accents.
- Build Sequences: Layered animations that unveil metrics step-by-step, building suspense in forecasts.
To customize, open the .key file, select a diagram, and use the data editor to map Excel columns - labels auto-adjust, axes scale intelligently. For multi-scenario analysis, duplicate slides and toggle datasets via hyperlinks, creating a choose-your-path deck.
Targeted Applications: Budgets to Boardrooms
Excel in budgeting: employ the pyramid diagrams to hierarchize expense categories, spotlighting efficiencies. In mergers, bubble charts map synergies by size and overlap, facilitating due diligence visuals.
Here's a workflow for quarterly forecasts: import your Excel model into the line graph slide, color-code lines by scenario (base, optimistic), add trendlines via Keynote tools. Test in outline view to refine flow, then animate reveals for emphasis on variances.
- Export Excel ranges as tab-delimited text for paste-in.
- Apply scheme and align with corporate fonts.
- Insert explanatory notes in floating boxes.
- Preview in full screen for projection readiness.
- Save variants as themed masters for reuse.
Outpacing standard Keynote graphs, this template's financial-specific layouts reduce misalignment errors, accelerating from draft to delivery. It's invaluable for remote audits, where shared screens demand self-explanatory clarity.
Pro Tips for Impactful Financial Decks
Anchorage insights with context - prefix charts with "The Opportunity Ahead" to frame growth. For global teams, incorporate currency converters in tooltips, enhancing cross-border relevance. Echoing practices from firms like Deloitte, consistent iconography reinforces themes across slides.
Streamlining Your Analytical Workflow
Optimized for Keynote 2016+, it handles large datasets without lag, exporting to interactive PDFs for stakeholder reviews. The modular design encourages iteration, turning one-off reports into evergreen assets.
Chart your path forward - grab this financial growth Keynote template for $22 and fuel informed decisions.
Frequently Asked Questions
How does Excel integration work in this template?Paste data directly into charts or link files for automatic syncing during edits.
Are the diagrams scalable for large presentations?Yes, vector-based for sharp rendering at any zoom or export size.
What color schemes are available?Seven, tailored for financial themes like blues for trust and greens for growth.
Can I use this for non-profit financials?Certainly; adapt for donor reports or grant proposals with ease.
Does it include forecasting tools?Built-in trend lines and projections via data extrapolation features.
Good for
- Project roadmaps and sprint plans
- Product launch timelines
- Quarterly or annual review decks
- Company history and milestone summaries
Licence
reviews
Prepared my quarterly marketing review using this template and finished two days ahead of schedule. The slide variety allowed me to present campaign metrics in an engaging way without rebuilding everything from scratch.
Design feels contemporary with balanced white space and consistent typography across sections. Color accents highlight key data points effectively while keeping the overall look calm and corporate.
Strong on visuals but the chart placeholders required more data reformatting than expected for my specific datasets. Still a net time saver and the end result impressed leadership.
I expected more built-in animation presets but managed with Keynote defaults easily enough. The core layouts are flexible enough to overcome that small gap.
This one helped me structure a client proposal deck last week. The professional appearance boosted my confidence during the meeting.
Used it successfully for a product launch overview. The flow felt natural and easy to follow.
The layouts supported my narrative well during a conference talk. Minimal adjustments needed on my end.
Nice balance of creativity and structure that worked for both printouts and screen presentation.
FAQ
Will it work in Google Slides?
Are fonts embedded?
Can I use this for client work?
What's the refund policy?
Do you update the template after purchase?
Similar templates
See all Keynote templates →


All 1 slides