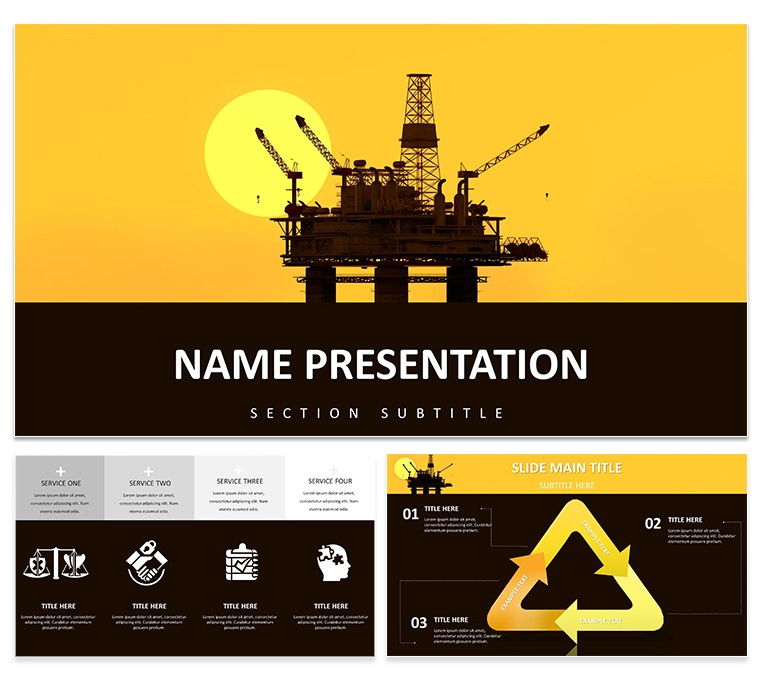
Amid the roar of rigs and the vast horizon of opportunity, your presentations must cut through like a well-struck gusher. The Oil Rig Power Keynote Template, at just $22, delivers that force - a rugged yet refined collection of 28 diagrams forged for energy sector trailblazers. From exploration scouts to refinery managers, this tool equips you to chart courses through volatile markets with visuals as bold as a sunset silhouette against the derrick.
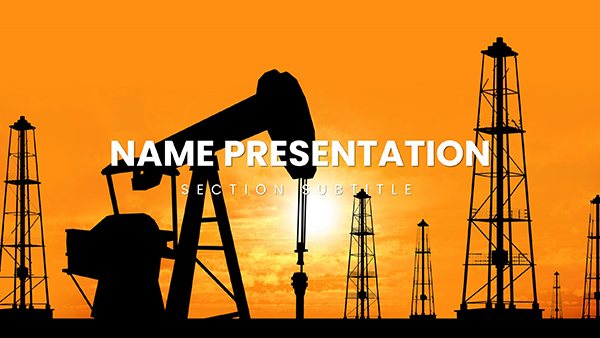
Envision decks where seismic waves ripple across subsurface maps, production pyramids stack yields layer by layer, and risk radars sweep threats in real-time arcs. Three masters anchor your narrative - industrial steel for ops reviews, amber glows for strategy sessions - paired with three backgrounds evoking offshore platforms or pipeline veins. Seven color schemes, from hazard oranges to deep-sea indigos, adapt to your field's grit.
Powered for Keynote 2016+, it honors the industry's demands: robust vectors withstand zoom-ins on fault lines, editable layers let you overlay well logs without rework. It's the rig hand's ally - turning raw reports into rallying cries that sway stakeholders from Houston to the North Sea.
Fuel-Injected Features for Field-Ready Flow
This template's diagrams are drilled for depth. The extraction timeline? A horizontal bore tracing from seismic surveys to first oil, with milestone flares marking hits - adjust depths via sliders, linking to cost curves for holistic views. Icons of valves, vents, and vessels add authenticity, all scalable for blueprint precision.
Masters manage the mundane: footers with safety stamps, headers logging dates like drill bits. Backgrounds infuse atmosphere - a faint rig lattice for texture, or gradient flares mimicking gas burns. Tweaks are torque-simple: select a scheme, and harmonics update across the board, syncing with your HSE palette.
- Seismic Sections: Waveform graphs for survey data, with peak annotations editable for anomaly calls.
- Yield Yards: Funnel flows for throughput, branching to sub-processes like cracking or blending.
- Rig Radials: Polar plots for directional drilling, angles adjustable for azimuth accuracy.
For compliance, embed hyperlinks to regs docs; the structure supports footnotes without cluttering sightlines.
Striking Oil in Applications: From Rigs to Reports
Exploration teams, prime your prospect pitch with the resource map slide: contour lines for reserves, heat-scaled by viability - pin drill sites, animate surveys unfolding like echoes. A geologist recounted using this to greenlight a basin, the layered visuals exposing potential partners couldn't ignore.
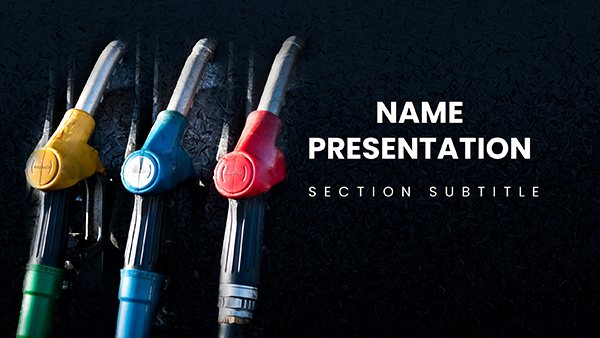
Production and Refining: Pumping Precision
In ops huddles, the efficiency dashboard gauges uptime: donut rings for downtime causes, needles pivoting on KPIs. Input telemetry, watch thresholds flash warnings - keeps crews calibrated. Refiners route crude paths through schematic pipes, valves toggling capacities for scenario spins.
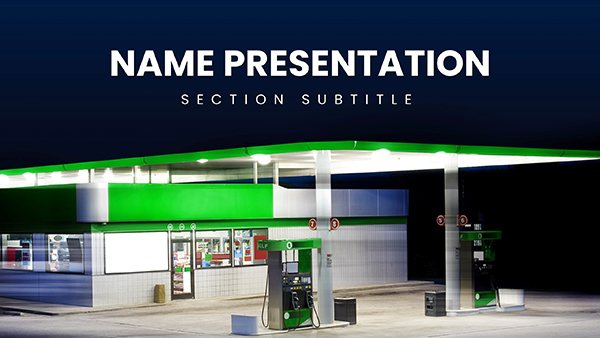
Environmental reps wield the impact ledger: before-after bars for emissions cuts, geo-tagged to sites. It's stewardship in slides - demonstrating carbon captures with stacked offsets, turning audits into advocacy. Construction kin adapt for builds: phase chains linking fab yards to hookups, icons flagging weather windows.
- Site Your Sources: Collate logs and assays into the data wells.
- Bore and Build: Layer onto maps, Keynote snapping strata straight.
- Flow and Forecast: Animate extractions, projecting barrels with easing curves.
- Cap and Convey: Review on rig tablets for on-site sign-offs.
Investor decks? The valuation vortex swirls cash flows, NPV spirals coiling returns - spin to stress-test variables, forging fiscal fortitude.
Rigorous Refinements: Tips for Torque-Max Decks
Optimize for the field: Compress embeds for offshore bandwidth, using Keynote's optimize tool. For night shifts, invert to high-contrast for visor views. Infuse narrative with field lingo - label a slide "Blowout Preventer Best Practices" to resonate raw.
Collaboration cue: Share via Keynote Live for remote rig reviews, annotations accruing like after-action logs. These rigs make your presentations as unbreakable as alloy.
Tap into power - secure the Oil Rig Power Keynote Template for $22 and strike presentations that endure.
Frequently Asked Questions
What industry-specific diagrams stand out?Seismic profiles, production funnels, and risk radars, tuned for oil and gas workflows.
Handling sensitive data securely?Local edits keep everything offline; export watermarked previews for shares.
Adaptable for renewables too?Yes - repurpose flows for wind farms or solar yields with icon swaps.
Animation for process demos?Built-in sequences simulate flows, like crude pumping, with speed controls.
Works on field devices?Optimized for iPads and laptops, with touch-friendly edits for quick fixes.
Color schemes for safety compliance?Includes high-vis options meeting OSHA contrasts for hazard highlights.