Imagine transforming dry equations into captivating visuals that hold your audience's attention from the first slide. That's the power of the Mathematics Keynote Template, designed specifically for educators, students, and researchers who want to make math not just understandable, but unforgettable. With 28 meticulously crafted diagrams, this template turns abstract concepts like algebra integrals or geometric proofs into clear, professional displays. Whether you're prepping for a university lecture, a high school workshop, or a research symposium, these slides provide a clean, modern canvas that lets your ideas shine.
Built for Keynote users, this template supports seamless editing in versions 2016 and later, ensuring compatibility across Mac devices. You'll find a serene blue and white color scheme that promotes focus and readability, perfect for late-night prep sessions or live projections. Beyond the basics, it includes versatile layouts for text, images, graphs, and charts, allowing you to mix in real-world examples - like plotting supply-demand curves for economics crossovers - without starting from scratch. And at just $22, it's an investment that pays off in saved hours and boosted engagement. Ready to diagram your next breakthrough? Let's dive into what makes this template a classroom essential.
Unlocking the Core Features of Your Math Keynote Toolkit
At the heart of this template lies a library of mathematical elements tailored for precision and impact. From vector-based symbols for calculus derivatives to interactive equation builders, every component is drag-and-drop ready. Picture starting with a title slide that poses a intriguing problem, like "How does the Fibonacci sequence mirror nature's patterns?" - then flowing into section dividers that use subtle grid lines to signal topic shifts.
- Equation Mastery: Pre-loaded formulas cover algebra through advanced topology, all scalable for any slide size.
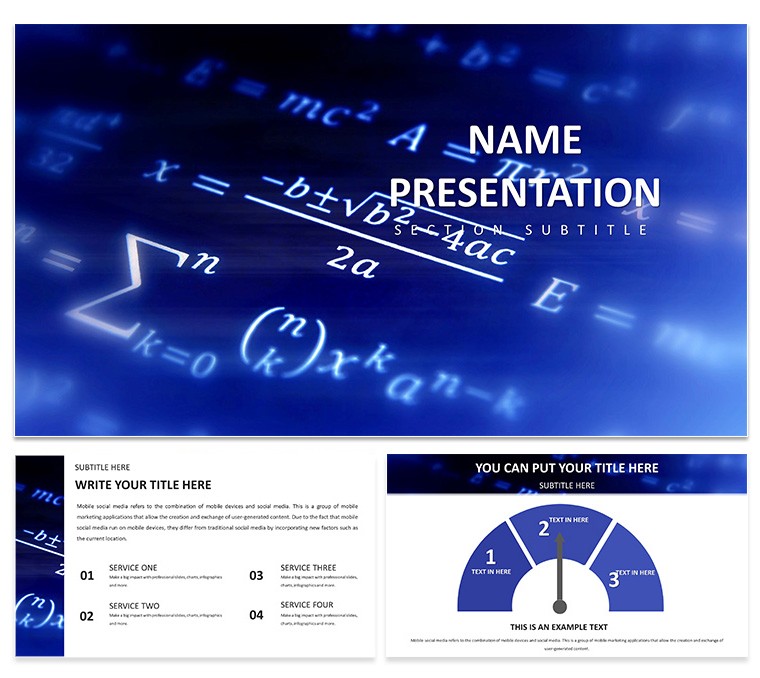
- Diagram Diversity: 28 unique visuals, including pie charts for probability distributions and line graphs for function plotting, each with seven color variations to match your branding.
- Customization Ease: Swap fonts to sans-serif for modern vibes or adjust opacity on overlays for layered proofs - changes reflect instantly across masters.
- Media Integration: Embed photos of fractals or short animations of rotating polyhedrons to bring static math to life.
These aren't just pretty pictures; they're tools that streamline your workflow. For instance, in a geometry lesson, layer a Venn diagram over a coordinate plane to illustrate set intersections visually, saving you the hassle of manual alignments.
Streamlining Slide Creation: A Step-by-Step Guide
- Select Your Base: Choose from three master layouts - minimalist for theorems, detailed for proofs, or hybrid for mixed media.
- Populate Content: Drag in your LaTeX-exported equations; the template auto-formats them into crisp, readable text.
- Enhance Interactivity: Add hyperlinks to slides for drill-downs, like jumping from a stats overview to a detailed regression model.
- Preview and Polish: Use Keynote's built-in presenter notes to jot reminders, ensuring smooth delivery.
This process cuts prep time dramatically, letting you focus on the "why" behind the numbers rather than the "how" of design.
Real-World Applications: Where Math Meets Storytelling
Think of this template as your narrative bridge between numbers and insights. In a research conference, use the timeline diagram to chart the evolution of number theory, branching into key theorems with bullet-point annotations. Or, for student projects, assign a slide deck where they customize a scatter plot to visualize data from a science fair experiment - fostering ownership while teaching analysis.
Educators at institutions like MIT have long emphasized visual aids in STEM; this template echoes that by providing ready-to-use assets that align with pedagogical best practices. Consider a workshop on linear programming: Start with an infographic overview, then zoom into constraint graphs, ending with a Q&A slide featuring poll embeds for audience input.
For online courses, export sections as standalone modules - perhaps a video-embedded slide on differential equations - making asynchronous learning more digestible. The result? Audiences not only grasp concepts faster but retain them longer, turning passive listeners into active problem-solvers.
Tailored Use Cases for Diverse Learners
- Lectures and Seminars: Structure hour-long sessions with phased slides: intro hook, core explanation, application example, and recap quiz.
- Student-Led Talks: Empower juniors to build portfolios, using pyramid charts to hierarchy learning objectives.
- Professional Development: Train adjuncts on curriculum mapping via mind-map style diagrams.
One math department head shared how swapping generic slides for these themed ones sparked more post-class discussions, proving visuals' role in deeper engagement.
Why This Template Stands Out in a Sea of Slides
Unlike basic Keynote defaults, which often feel cluttered or outdated, this template prioritizes elegance and functionality. Its vector graphics ensure crispness at any zoom, and the modular design means you can repurpose elements across decks - say, recycling a matrix layout for future stats units. Plus, with built-in accessibility features like high-contrast modes, it caters to diverse classroom needs without extra tweaks.
Integrate it into your routine: Pair with tools like Desmos for live graphing imports, or Notion for content outlining before sliding in. The payoff is presentations that feel bespoke, even on tight deadlines.
Customize your math storytelling today - grab this template and watch your slides solve engagement equations effortlessly.
Frequently Asked Questions
What versions of Keynote does this template support?
It works seamlessly with Keynote 2016 and newer versions on macOS.
Can I adjust the color schemes for my school's branding?
Yes, all 28 diagrams offer seven editable color options, plus full theme overrides.
Are the mathematical symbols editable without coding?
Absolutely - use Keynote's text tools to modify or insert new ones via the symbol menu.
Does it include animations for equations?
Basic transitions are pre-set; add custom builds for step-by-step reveals in the animations tab.
How many slides come with the download?
You get 28 diagram slides plus title, content, and divider masters for unlimited expansion.
Is it suitable for non-math subjects?
While math-focused, the layouts adapt well to data-heavy topics like physics or economics.