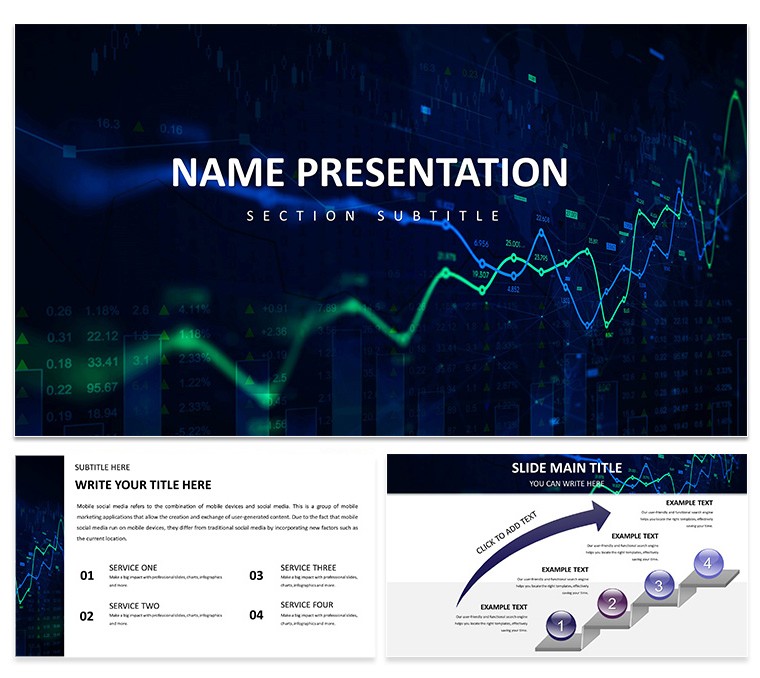
In boardrooms where numbers drive destinies, the right visuals can illuminate paths to profitability or flag risks before they crest. The Visualization Financial Data Keynote Template is engineered for that precision, offering 59 meticulously crafted slides for finance whizzes, executives, and advisors. Keynote-optimized for Mac, it distills complex ledgers into digestible diagrams, using ledger-line accents and currency symbols to ground abstract figures in tangible impact.
Say goodbye to spreadsheet dumps and hello to strategic storytelling: three masters organize fiscal narratives - from executive summaries to deep-dive audits - paired with three backgrounds evoking market pulses or balanced scales. The 28 diagrams are fiscal powerhouses: waterfall charts for profit breakdowns, funnel visuals for sales pipelines, and heat maps for risk assessments, all awaiting your metrics.
Seven color schemes navigate data moods - cool greens for growth projections or cautionary reds for variances - fine-tuned for dashboard-like readability. A startup founder leveraged the ROI radial to pitch venture rounds, spiraling investments into returns that hooked funders instantly.
Precision Tools for Fiscal Mastery
The backbone: masters with ledger headers for intros, matrix layouts for comparisons, and forecast footers for projections. Backgrounds vary from grid papers to trend-line weaves.
- 28 Data-Driven Diagrams: Sankey flows for cash movements, bubble plots for portfolio diversifications, tree maps for expense hierarchies.
- Seven Analytical Palettes: Bull-market brights or bear-alert dims, WCAG-compliant.
- Intuitive Adaptability: Formulas link to imported tables; animate paths for quarter-over-quarter evolutions.
Keynote editing empowers: format series in charts via data editor, layer shadows for depth. It's built for the analytical grind.
From Reports to Revelations: Finance Scenarios
For quarterly earnings, balance sheet breakdowns via stacked areas; a consultant mapped merger synergies with overlap Venns, clarifying ROI hurdles. In budgeting workshops, pie variants allocate resources visually.
Entrepreneurs use forecast lines for pitch decks; educators in finance courses dissect market crashes via candlestick proxies.
- Scope Your Dataset: Gather KPIs like revenue streams.
- Map to Visuals: Align figures to diagram types.
- Annotate Insights: Callout trends with arrows.
- Validate Accuracy: Cross-check with source files.
- Iterate for Audience: Simplify for non-experts.
Far beyond basic graphs, it crafts narratives that sway stakeholders.
Optimization Hacks for Data Dominance
Tie schemes to fiscal calendars - year-end warms. Keynote's equation editor embeds live calcs. For mobiles, responsive scales maintain fidelity.
Pair with Numbers for dynamic updates. Echoing analyst toolkits for IPO roadshows, it supports version control. Repurpose for annuals.
It turns quants into communicators.
Illuminate Your Financial Future
This template bridges data to decisions, empowering presentations that don't just report - they reveal. Snag the Visualization Financial Data Keynote Template for $22 and chart courses with unerring visual acumen.
Frequently Asked Questions
What types of financial diagrams are included?
Varied, from waterfalls for P&L to funnels for conversions.
Can it integrate with spreadsheet data?
Yes, paste or link from Numbers for auto-updates.
Is it geared for executive summaries?
Precisely, with concise masters for high-level overviews.
How flexible are the layouts for custom metrics?
Highly - placeholders adapt to any dataset size.
Supports forecasting visuals?
Affirmative, with line and bar projections built-in.