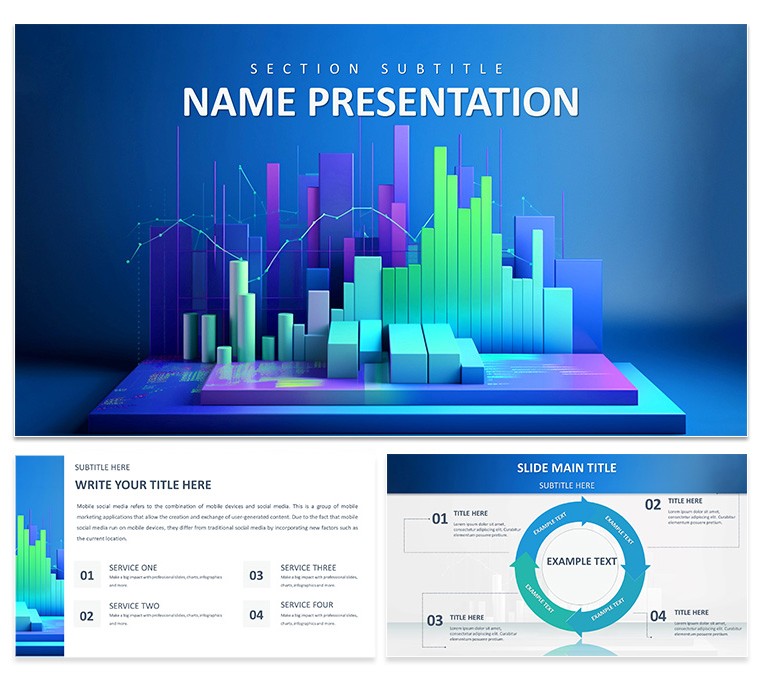
In the fast-paced arena of boardrooms and strategy sessions, where data screams louder than words, the Business Graph Keynote Template stands as your silent powerhouse. Crafted for business analysts, marketers, and consultants who wrestle daily with spreadsheets, this template distills raw numbers into sleek, story-driven visuals that command attention. Boasting 28 versatile diagrams across seven crisp color schemes, it covers everything from SWOT matrices to sales funnel flows, ensuring your presentations don't just inform - they persuade.
Envision a quarterly review where line graphs snake upward like success trajectories, or pie charts slice market shares with surgical precision. These aren't mere placeholders; they're dynamic tools that adapt to your dataset, letting you swap figures, tweak axes, and layer in annotations that highlight trends at a glance. Compatible with Keynote's latest builds, the three master layouts - ranging from corporate neutrals to bold accents - keep your branding intact while the backgrounds provide subtle depth without stealing the spotlight.
For a sales VP navigating Q3 forecasts, this means flowcharting lead-to-close pipelines with interconnected nodes that reveal bottlenecks, prompting nods of agreement around the table. A consultant pitching to startups could deploy radar charts to benchmark competitors, visually underscoring unique value props. It's about bridging the gap between backend analytics and frontend impact, making dense reports feel approachable and actionable.
Delving into Design and Functionality
The template's strength lies in its breadth: bar graphs for year-over-year comparisons, scatter plots for correlation dives, and process diagrams that map workflows like a well-oiled machine. Each of the 28 diagrams comes pre-formatted for drag-and-drop data entry, with icons - think gears for operations or arrows for growth - that you can recolor or resize to fit narratives.
Customization flows naturally: adjust fonts for readability on projectors, or harness Keynote's smart guides for pixel-perfect alignments. The seven schemes cater to moods - monochromatic for formal audits, vibrant for creative brainstorms - while ensuring accessibility with high-contrast options. Export options abound: PDF for distribution, video for social clips, or even interactive hyperlinks for deeper dives during virtual meets.
Spotlight on Slide Varieties
- Financial Dashboards: Cluster column charts grouping revenue streams, with trend lines forecasting dips and peaks.
- SWOT Analyses: Quadrant layouts with bullet-friendly quadrants, expandable for detailed pros and cons.
- Market Overviews: Donut charts encircling segment breakdowns, paired with adjacent text for context.
- Performance Metrics: Gauge dials simulating speedometers for KPI tracking, animating to target values.
Animations add polish - sequential reveals build suspense in multi-part insights, keeping audiences hooked as layers unfold.
Practical Scenarios: Graphs in Action
Consider a marketing lead at a tech firm using this for campaign recaps: Start with an overview funnel visualizing touchpoints, then zoom into ROI heatmaps that color-code channel efficiencies. Step one: Populate the editable tables with Google Sheets imports. Two: Fine-tune legends to spotlight wins, like email's edge over PPC. Three: Rehearse transitions, ensuring smooth handoffs between slides. The result? Stakeholders grasp ROI at a glance, sparking discussions on scaling successes.
Versus cobbling together in vanilla Keynote, this template accelerates from concept to critique-ready, with built-in consistency that polishes even rushed decks. For educators teaching data literacy, embed these in lesson plans - students remix pyramid hierarchies to model org structures, learning by doing.
Pro Tips for Peak Performance
- Integrate live data via Keynote's iCloud sync for real-time updates during all-hands.
- Layer subtle gradients on backgrounds to guide eyes toward focal charts without clutter.
- Pair with presenter notes for verbal cues, turning graphs into conversational anchors.
When data feels like a deluge, this template is your dam - channeling it into clear streams that nourish decisions and propel progress.
Chart Your Course Forward
Secure the Business Graph Keynote Template now for $22 and watch your presentations evolve from informative to influential. Your data deserves to shine - let it.
Frequently Asked Questions
What types of graphs are included?
From bar and line to pie and radar, covering essentials like flowcharts and SWOT grids.
Is it suitable for beginners?
Yes, with intuitive edits and no advanced skills needed for pro results.
How do the color schemes work?
Seven options, each with coordinated palettes for diagrams and accents.
Can I add my own data easily?
Absolutely - copy-paste from Excel or link dynamically for updates.
Does it support animations?
Pre-set builds and transitions enhance reveals without complexity.
What's the compatibility?
Fully works with Keynote 2016 and later on Mac and iOS.