The Financial Analytics Keynote Template with Data Visualization is intended to achieve just that. Whether you're a financial analyst, business consultant, or CEO, this template provides strong tools to bring your data to life. Read on to see how this template may improve your presentations and make your facts more compelling.
Why Does This Template Matter?
In today's fast-paced corporate environment, making clear, convincing presentations is critical. Financial data may be complex and daunting, but our template makes your information more accessible and interesting. Here's why you need this template:
- Present complicated financial facts clearly and precisely.
- Engage your audience using visually attractive images.
- Save time with pre-designed presentations for financial analysis.
Key Highlights of the Financial Analytics Keynote Template
Our template has features tailored to your requirements:
- Data visualization: Charts, graphs, and infographics may help you convert statistics into visual narrative.
- Customizable Slides: Customize each slide to match your facts and message.
- Professionally designed: Clean, modern aesthetics will help you wow your audience.
- User-Friendly: Simple to use, even if you are not a design expert.
Benefits of Using Our Template
Using the Financial Analytics Keynote Template has various benefits:
- Improved Understanding: Make your data more understandable.
- Increased Retention: Assist your audience in remembering important information.
- Improved Decision Making: Present facts in a way that allows for better business judgments.
Who Can Benefit From This Template?
This template is ideal for:
- Financial analysts: Present clear and in-depth financial reports.
- Business Consultants: Effectively present your ideas and recommendations.
- Corporate executives: Communicate financial performance and predictions to stakeholders.
- Educators and Trainers: Use visually appealing teaching aids to convey financial ideas.
What the Template Contains:
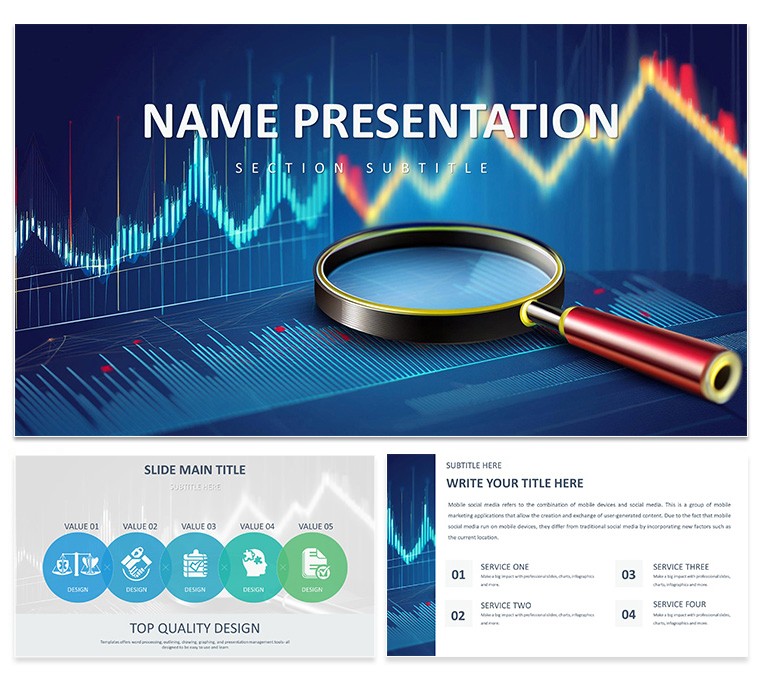
The Financial Analytics Keynote Template includes:
- Title Slides: Create a powerful first impression.
- Overview Slides: Provide a synopsis of your presentation.
- Facts Slides: Present financial facts using various charts and graphs.
- Analysis Slides: Divide difficult material into digestible chunks.
- Conclusion Slides: Summarize your results and offer further measures.
Imagine delivering a quarterly financial report. Instead of bombarding your audience with rows of statistics, utilize our template to tell a visual story:
- Highlight Trends: Use line graphs to demonstrate revenue increase over time.
- Use bar charts: Compare quarterly results.
- Use pie charts: Show market share.
Are you ready to revolutionize your financial presentations? Download the Financial Analytics Keynote Template with Data Visualization immediately and begin producing powerful, memorable presentations. Don't just offer statistics; develop a story that connects with your audience.
Our Financial Analytics Keynote Template is the key to creating interesting and effective financial presentations. With its user-friendly interface and robust capabilities, you can show your data confidently and clearly. Make a wise decision and improve your presentations immediately.
Download the Financial Analytics Keynote Template immediately and experience its impact!