 Click to zoom
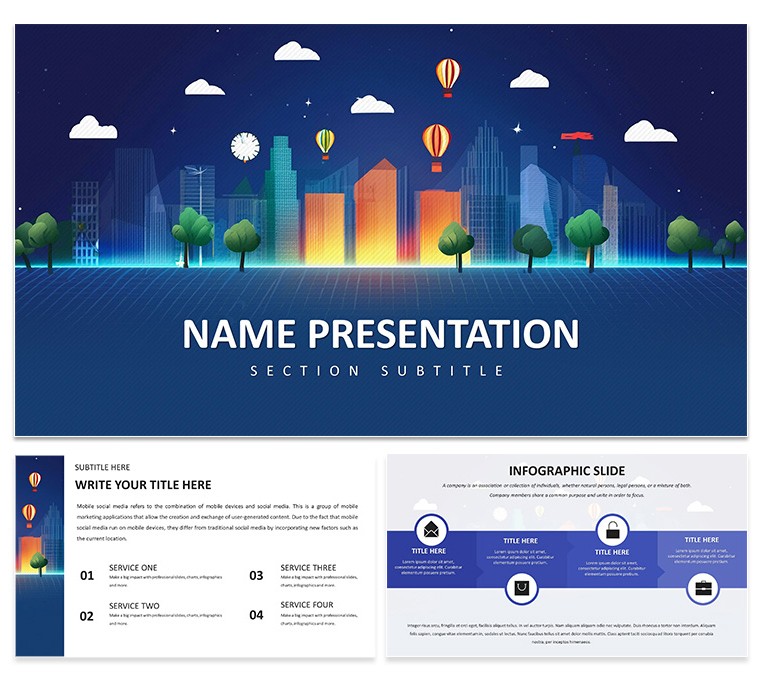
Urban Economy Keynote Template: Data-Driven Insights
| Format | .pptx |
| Slides | 3 unique layouts |
| Aspect ratio | 16:9 |
| Compatibility | PowerPoint |
| Animated | No |
| Language | English |
| License | Commercial |
| File size | — |
| Version | v1.0 |
| Last updated | June 2024 |
What's inside
Imagine stepping into a boardroom where your slides don't just show numbers - they tell the story of a city's heartbeat. The Urban Economy Keynote Template is crafted for economists, urban planners, and policymakers who need to make complex data feel alive and accessible. With its clean lines and focused data visualization, this template turns abstract concepts like urban growth factors or policy impacts into visuals that stick. You'll get 28 diagram slides, three master layouts, three background options, and seven versatile color schemes, all compatible with Keynote 6.0 and later. Whether you're dissecting the history of urban economics or highlighting government roles in city development, this tool lets you swap in your logo, tweak charts, and present with confidence. It's not about flashy effects; it's about clarity that drives decisions, like how a well-mapped obstacle in urban living can spark real policy shifts. Professionals in this field know the frustration of starting from scratch - spending hours aligning bars and lines only to end up with something generic. Here, you start with purpose-built elements that adapt to your narrative, freeing you to emphasize opportunities over obstacles. Download this template for $22 and watch how it streamlines your workflow, making every presentation a step toward smarter urban futures.
Unlocking the Core Features for Smarter Presentations
At the heart of this template lies a design philosophy rooted in simplicity and precision, much like the foundational models used by urban economists to predict city expansions. Each of the 28 diagram pages is ready to handle everything from timeline histories to comparative opportunity charts, ensuring your audience grasps nuances without overload.
- Versatile Diagram Library: From flowcharts tracing urban policy evolution to pie charts breaking down growth influencers, these slides are drag-and-drop friendly.
- Color Harmony Options: Seven schemes let you match corporate blues for formal reports or vibrant greens for sustainability-focused talks.
- Master Layout Flexibility: Three masters mean seamless transitions between data-heavy sections and lighter overviews, keeping your flow uninterrupted.
- Background Variety: Choose subtle cityscape motifs or plain professionalism to suit the venue, all scalable for high-res displays.
These aren't just static assets; they're building blocks tested for real-world use, like in sessions where planners map out mixed-use developments. The editable vectors ensure crispness even when zoomed, a detail that separates polished work from the rest.
Step-by-Step: Bringing Your Urban Vision to Life
Getting started feels effortless, designed for those late-night prep sessions before a council meeting. Here's how to integrate it into your process:
- Download and Launch: Grab the .key file and open in Keynote - your sources include layered .kth for deeper edits if needed.
- Personalize the Canvas: Insert your firm's logo on the master slide, then select a color scheme that echoes your report's tone.
- Populate with Data: Drag your urban growth stats into a diagram; animations are pre-set but toggle off for print-friendly versions.
- Refine and Rehearse: Adjust fonts for readability - think sans-serif for quick scans - and preview transitions to ensure they underscore key points like policy bottlenecks.
- Export and Share: Output as PDF for handouts or video for online webinars, maintaining that professional edge.
This sequence cuts prep time dramatically, letting you focus on the why behind the data, such as debating equitable urban expansion.
Real-World Applications: From Classroom to City Hall
For students diving into urban economics theses, this template shines in structuring arguments around historical evolutions, with slides that layer timelines effortlessly. Picture a grad presentation where factors like migration patterns unfold via interactive maps - your audience leans in, not zones out.
Urban planners find it indispensable for stakeholder workshops, where illustrating obstacles like infrastructure strains alongside opportunities in green spaces builds consensus. One approach: Use a SWOT-style diagram to balance challenges with innovative solutions, drawing from established frameworks in city planning texts.
Policymakers, meanwhile, leverage it for budget justifications, embedding government role visuals that link expenditures to outcomes. In a recent advisory session on affordable housing, similar layouts helped clarify fiscal impacts without jargon overload.
Even business consultants advising on real estate ventures use these slides to forecast urban trends, customizing icons for market-specific icons like zoning shifts. The template's modularity supports hybrid formats, blending live demos with pre-recorded segments for broader reach.
Customization Tips to Match Your Brand
While the defaults evoke metropolitan efficiency, tailoring is where it excels. Start by swapping background images for locale-specific skylines, ensuring cultural relevance - say, a European vs. Asian urban profile. Fonts? Opt for clean options like Helvetica for global readability.
For data depth, layer in hyperlinks to source documents on slides about policy influences, turning your deck into an interactive resource. And for accessibility, add alt text to charts describing urban growth metrics, a nod to inclusive design principles.
Pro tip: Test on different devices early; the responsive elements hold up from iPad pitches to projector screens, a reliability born from Keynote's native strengths.
Why This Template Stands Out in a Crowded Field
Compared to vanilla Keynote setups, this one anticipates your needs - pre-loaded diagrams mean no fumbling with shapes mid-edit. It's like having a co-pilot who's studied urban dynamics, offering shortcuts to visuals that resonate.
Elevate your next urban economy discussion with tools that prioritize insight over ornamentation. Ready to map out success? Secure your copy for $22 and start visualizing tomorrow's cities today.
Frequently Asked Questions
Is this template fully editable in Keynote?
Yes, all elements including diagrams, colors, and text are fully customizable right within Keynote 6.0 or newer versions.
What file formats are included?
You'll receive .key for direct use, .kth for themes, and .jpg previews for quick references.
Can I use it for non-commercial purposes like student projects?
Absolutely, it's versatile for personal, educational, or business applications without restrictions.
How many color schemes are available?
Seven distinct schemes allow adaptation to various presentation themes or branding needs.
Does it support animations?
Pre-built subtle animations are included but can be easily removed or adjusted for your style.
Good for
- Project roadmaps and sprint plans
- Product launch timelines
- Quarterly or annual review decks
- Company history and milestone summaries
Licence
reviews
The cityscape motifs and clean lines fit perfectly for my urban planning proposal.
Used the flowcharts to trace policy evolution.
The green schemes worked well for my sustainability report.
A bit too focused on government work but the data slides are generic enough.
The SWOT-style diagrams helped balance the infrastructure challenges with solutions.
FAQ
Will it work in Google Slides?
Are fonts embedded?
Can I use this for client work?
What's the refund policy?
Do you update the template after purchase?
Similar templates
See all Keynote templates →

All 1 slides