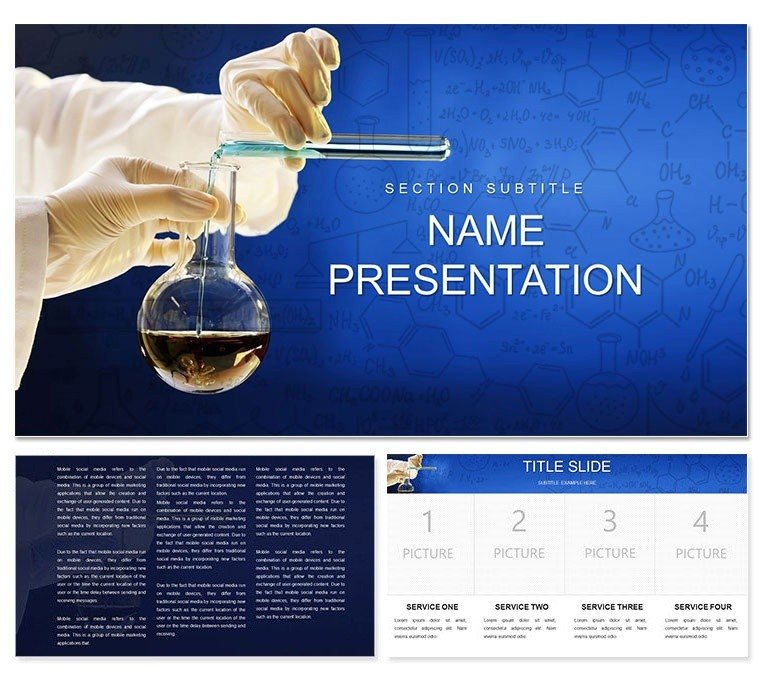
Where molecules meet narratives, the Chemistry Experiments Keynote template brews presentations that fizz with fascination. Aimed at lab instructors, researchers, and STEM advocates, it delivers 28 reaction-ready diagrams, three lab-coat masters, and three elemental backgrounds. From titration demos to polymer puzzles, craft slides that catalyze understanding and excitement.
The magic? Precision in play - diagrams bottle complex reactions into visual vials, editable to your formula. Seven color schemes mimic spectra, from acidic reds to neutral grays, all Keynote-optimized for crystal-clear projections. Recast a bar graph as a test tube lineup, measuring yields; it's customization that distills hours into moments.
Elemental Essentials: Lab Bench Breakdown
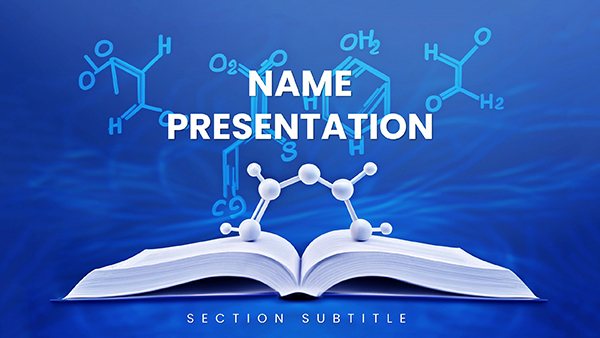
Three masters maintain experimental rigor, while backgrounds evoke fume hoods or periodic tables. Diagrams - 28 strong - equip reactions: sequences for syntheses, balances for equations, and networks for bonds.
- Reactive Vectors: Alter bonds or precipitates with drag-and-drop ease.
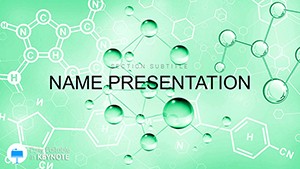
- Spectral Schemes: Seven for visibility, calibrated for safety posters too.
- Build Sequences: Layer for step-wise reveals, mirroring protocols.
A researcher visualized enzyme kinetics with a curve diagram overlaid on flask icons, clarifying rates for grant panels.
Lab Logs: Experimental Applications
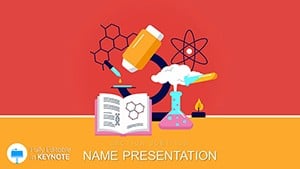
It excels in volatile venues. For classes, flow diagrams trace extractions, with editable arrows for variable paths. In industry briefs, matrices plot compound interactions, cells as beakers for quick scans.
Protocol: Keynote open, master select, diagram insert - tweak scales for accuracy. An instructor bubbled through electrolysis with a split diagram, halves as electrodes, engaging demos vividly.
- Assemble: .key load, background to lab vibe.
- React: Data infuse, elements resize for proportion.
- Observe: Animate bonds forming, pace to reactions.
Beyond basics, it hypothesizes engagement, testing visuals that prove effective.
Alchemist's Advice: Mixing Mastery
Integrate like a solvent - hyperlinks to data sheets, exports to animated GIFs for social shares. Tip: Gradient fills on gradients simulate diffusion, adding realism.
One lab lead compounded a periodic org chart with radial diagrams, orbits as groups - team chemistry improved. Procure to potion your presentations.
Frequently Asked Questions
Editable for specific reactions?
Yes, diagrams flex for organic or inorganic, reshaping paths accordingly.
Keynote compatibility?
From 2016 up, with full vector support intact.
Interactive demos possible?
Via builds and links, simulating step-by-step experiments.
Scheme suitability for print?
Seven ensure CMYK fidelity for handouts or posters.
For non-chem uses?
Adapts to physics flows or bio processes seamlessly.