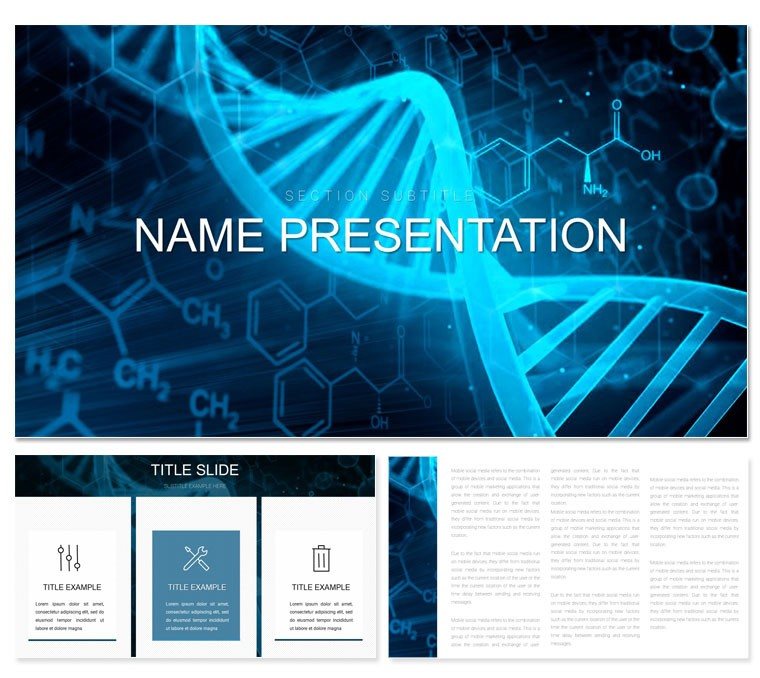
In the delicate dance of medical education, where empathy meets evidence, your slides can bridge the gap between complexity and comprehension. The Genetic Disorders and Diseases Keynote Template for Medical Presentations is crafted for doctors, researchers, and educators who illuminate paths from diagnosis to hope. With 28 diagrams enveloped in soothing blues and neutrals, it dissects causes, symptoms, diagnostics, and treatments without overwhelming the eye. Keynote-compatible since 2016, this tool lets you personalize with patient anonymized data or study visuals, fostering discussions that resonate in conferences or classrooms.
Aimed at informational intent with a professional touch, it soothes the strain of dense textbooks by visualizing inheritance patterns or therapy timelines. Three masters guide your structure - one for overview symposia, another for seminar deep-dives, a third for patient consults - while backgrounds in soft gradients evoke calm labs. Like how genetic counseling sessions use simple trees to explain pedigrees, this template empowers you to convey nuance with grace.
Features That Foster Understanding and Empathy
Masters ensure thematic consistency: The overview prioritizes broad strokes, the deep-dive accommodates annotations, and the consult version minimizes text for dialogue space. Diagrams, 28 in total, range from Punnett squares for inheritance odds to flowcharts for diagnostic workflows, all in vectors for precise scaling.
Seven color schemes modulate from tranquil teals for symptom overviews to warmer taupes for treatment successes, applied effortlessly via theme selectors. Editing invites subtlety - tint a chromosome icon to highlight mutations, or resize symptom icons for emphasis.
- Visual Aids: Illustrations of DNA helices, organ cross-sections.
- Diagram Toolkit: Graphs for prevalence stats, timelines for disease progression.
- Layout Logic: Intuitive grids that align with medical hierarchies.
Integrating Illustrations for Deeper Diagnostics
Overlay microscopic images on diagnostic slides, using opacity blends for layered reveals. Animate symptom lists to appear progressively, mirroring consultation pacing. This mirrors practices in journals like Nature Genetics, where visuals clarify genomic variances.
Applications in Medical and Educational Arenas
For lectures, the pedigree diagram traces family histories, customizable with color-coded risks. In research shares, bubble charts size disorders by incidence, clustering comorbidities. Conference keynotes benefit from treatment pyramids, stacking options from gene therapy to lifestyle mods.
Structuring a seminar: Lead with a causes infographic, transition via duplicated timelines to outcomes. This flow aids retention, allowing pauses for queries on ethical implications.
- Research Gather: Populate diagrams with peer-reviewed figures.
- Tone Set: Choose a scheme evoking serenity for sensitive topics.
- Enhance: Add hyperlinks to sources for credibility.
- Practice: Time builds to sync with explanatory beats.
Advancing Past Plain Medical Slides
Outpacing defaults, it offers medically attuned proportions - taller for vertical flows like symptom cascades - and embeds empathetic elements like rounded edges. Tailored motifs, such as helix icons, eliminate generic searches.
Tips for Sensitive, Effective Deliveries
Pair visuals with reassurances: "This pattern affects 1 in X, but here's the breakthrough." Limit slides to essentials, using whitespace for reflection. For multicultural groups, universal symbols transcend language barriers.
Calibrate colors for color-blind viewers via built-in contrasts. These considerations make your content not just informative, but healing.
Illuminate lives with insight - acquire the Genetic Disorders template for $22 and present with purpose.
Frequently Asked Questions
Are illustrations medically accurate?
Based on standard references, editable for specific studies.
Keynote compatibility?
From 2016 onward, with full animation support.
Customizable for rare disorders?
Yes, adapt diagrams to any genetic profile.
Color schemes for accessibility?
Seven options, including high-contrast variants.
Usable in patient education?
Perfectly, with simplified masters for lay audiences.
Export for print?
High-res PDF ready for handouts.