 Click to zoom
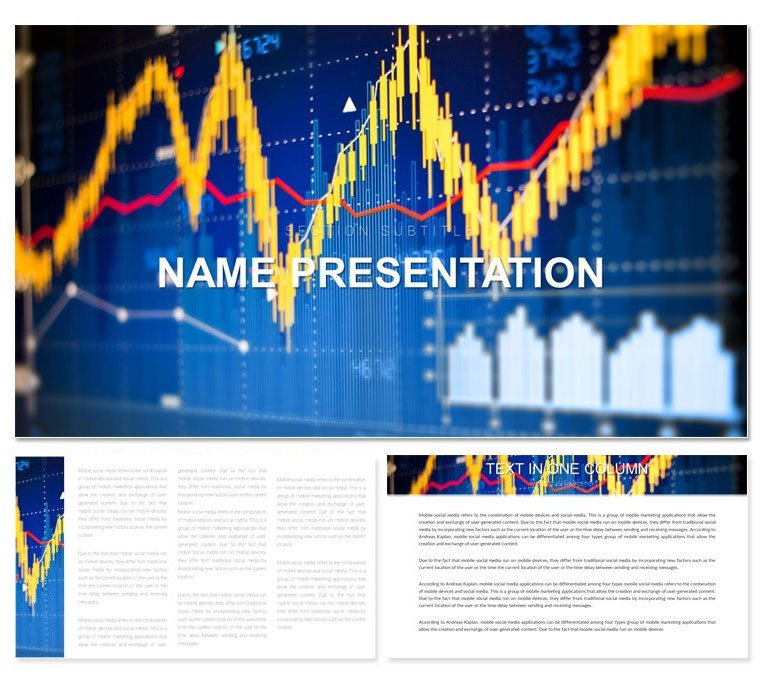
Trading View Keynote Presentation Template
| Format | .pptx |
| Slides | 3 unique layouts |
| Aspect ratio | 16:9 |
| Compatibility | PowerPoint |
| Animated | No |
| Language | English |
| License | Commercial |
| File size | — |
| Version | v1.0 |
| Last updated | March 2022 |
What's inside
In the fast-paced world of finance, where every chart tells a story and every slide can sway decisions, the Trading View Keynote template emerges as your strategic ally. Tailored for financial traders, analysts, and business leaders presenting on currency fluctuations, monetary systems, or cryptocurrency trends, this template packs 28 high-impact diagrams into a sleek, editable package. Compatible with iWork, it transforms raw data into compelling narratives that hold boardrooms captive.
Think of it as your canvas for demystifying complex trades - whether explaining bitcoin volatility to stakeholders or mapping global currency flows for a sales pitch. With three master slides and backgrounds, plus seven vibrant color schemes, you can align visuals with your firm's branding in minutes. No more wrestling with clunky defaults; this tool lets you focus on insights, not aesthetics, delivering presentations that drive action.
Crafting Narratives from Market Data
At its core, this template excels in turning numbers into stories. Start with pie charts dissecting portfolio allocations, where segments animate to reveal risk distributions, or line graphs tracking stock trajectories with smooth transitions. For bitcoin enthusiasts, dedicated crypto flow diagrams visualize blockchain transactions, making abstract tech tangible for novice audiences.
Customization flows naturally: swap placeholder data for real-time feeds, adjust line weights for emphasis, or layer in annotations that highlight key turning points. The high-quality images and inscriptions ensure professionalism, while the wide functionality supports everything from simple bar comparisons to intricate Sankey diagrams for trade balances.
Building a Trade Strategy Deck Step by Step
- Select Your Base: Choose a master slide suited to your angle - bold for aggressive strategies or balanced for conservative reviews.
- Layer in Data: Import CSV files into charts; the template auto-scales axes for clarity.
- Add Dynamics: Apply build animations to reveal bullish trends progressively, building tension like a market rally.
- Enhance with Visuals: Drop in stock ticker screenshots or currency icons from the library.
- Finalize Flow: Use timeline backgrounds to sequence quarters, ensuring a rhythmic progression.
This method not only structures your content but also mirrors the deliberate pace of successful trading, teaching your audience along the way.
Targeted Use Cases for Traders and Teams
Financial pros use this template across scenarios. A hedge fund manager might deploy radial diagrams to fan out diversification options, akin to how global banks visualize forex exposures in annual reports. For sales teams pitching investment services, interactive process maps guide prospects through onboarding, clarifying value at each step.
In cryptocurrency circles, leverage the network graphs to illustrate wallet connections, sparking discussions on security protocols. Or, for internal audits, Gantt-style timelines track compliance milestones, providing at-a-glance accountability.
- Currency Analysis: Heat maps for exchange rate variances.
- Monetary Policy: Flowcharts depicting central bank decisions.
- Trade Forecasting: Scatter plots correlating economic indicators.
Integrate with tools like Excel for live updates, keeping decks evergreen amid market shifts.
The Edge in Design and Functionality
What sets Trading View apart? Its unusual yet bright design avoids the sterility of standard finance slides, injecting energy without sacrificing precision. Fully editable elements mean you tailor to specifics - like retheming for emerging markets with earthy tones or high-tech palettes for fintech pitches.
Compared to basic Keynote charts, this offers pre-built intelligence: auto-aligning labels, responsive scaling, and icon sets from currency symbols to trend arrows. It's built for the road warrior, rendering flawlessly on projectors or shared screens.
Animations That Mirror Market Moves
Subtle effects like pulse fades for alerts or cascade reveals for multi-asset overviews keep viewers locked in. These aren't gimmicks; they're calibrated to underscore volatility, much like how trading floors use dynamic displays to signal opportunities.
Streamlining Your Presentation Pipeline
Weave this into daily routines: morning briefings with quick-update slides or quarterly reviews with comprehensive builds. For collaborations, share layered files where teams add regional data without overwriting cores.
The payoff? Sharper decisions, as visuals clarify what words alone obscure. Download the Trading View Keynote template for $22 and chart your path to persuasive presentations.
Frequently Asked Questions
What makes this template suitable for crypto presentations?
Specialized diagrams like flow networks and volatility charts handle blockchain and digital asset visuals effectively.
Is it easy to update with live market data?
Yes, charts link to external sources, refreshing automatically on Keynote reload.
Can I customize colors for brand matching?
Absolutely, with seven schemes and full editability for seamless integration.
Does it support iPad presentations?
Fully compatible with iWork on iPad for on-the-go edits and delivery.
Are there pre-built icons for finance?
Yes, including currencies, stocks, and trend symbols.
Good for
- Project roadmaps and sprint plans
- Product launch timelines
- Quarterly or annual review decks
- Company history and milestone summaries
Licence
reviews
The graphs looked decent on a big screen which surprised me honestly.
Needed something for a quick team report and this template was easy enough.
Some layouts felt too corporate for my taste but they were organized.
I liked the simple icon style instead of the giant glossy ones.
Good enough for a rushed presentation after work.
FAQ
Will it work in Google Slides?
Are fonts embedded?
Can I use this for client work?
What's the refund policy?
Do you update the template after purchase?
Similar templates
See all Keynote templates →


All 1 slides