Step onto the stage where numbers don't just add up - they illuminate paths forward. The Business Analytics Keynote Template equips consultants, executives, and data teams with 28 polished diagrams to dissect trends, forecast futures, and forge strategies. This modern toolkit turns raw metrics into refined narratives, helping you navigate boardrooms or client calls with unshakeable poise.
Featuring a crisp, professional veneer with three masters and backgrounds, it prioritizes clarity - think minimalist grids that let dashboards breathe. Every chart, table, and image is primed for your inputs, from sales funnels to KPI trackers, all editable in Keynote for swift iterations. It's the bridge between complex datasets and compelling delivery.
Core Strengths: Visualizing Victory
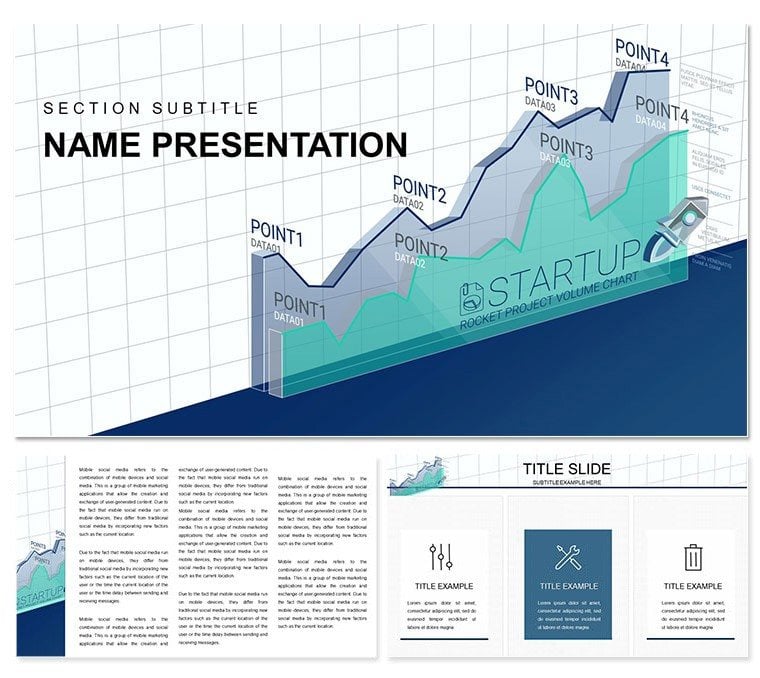
The 28 diagrams, spanning seven color schemes, form the backbone - line graphs for growth arcs, heat maps for risk zones, each vector-perfect for scaling.
- Dashboard Dynamics: Pre-built layouts for multi-metric views, customizable to spotlight quarterly variances.
- Table Flexibility: Sortable grids that adapt to your queries, with conditional formatting nods.
- Scheme Spectrum: From corporate grays to strategic blues, aligning with brand vibes effortlessly.
A strategy lead at a fintech firm layered funnel diagrams to trace user drop-offs, animations revealing bottlenecks that reshaped their app flow. Precision like that turns analytics into action.
Strategic Scenarios: Analytics in Action
Versatile for board-level briefs or team huddles, it shines in forecasting sessions - use scatter plots to correlate market drivers, projecting with confidence. Consultants craft client recaps via timeline tables, embedding projections that underscore ROI.
For operational reviews, radial charts dissect department efficiencies, color-coding pain points for targeted fixes. Even investor updates benefit, with pie breakdowns of portfolio allocations that build trust through transparency.
Blueprint for Building Boards
- Frame Your Focus: Choose a master for depth - detailed for dives, summary for scans.
- Input Intelligence: Feed data into diagrams, selecting schemes that highlight anomalies.
- Animate Angles: Sequence reveals for trend builds, syncing with your explanatory beats.
- Validate Vision: Preview exports to PDF or video, ensuring fidelity across shares.
A analytics manager streamlined annual planning by templating scenario models, allowing what-if swaps that accelerated buy-in from execs.
Outpacing Plain Data Displays
Beyond Keynote's defaults, this infuses analytics-specific smarts - like axis auto-scales for volatile metrics. Tables handle merges seamlessly, pulling from Sheets for live syncs.
For distributed teams, backgrounds offer subtle textures that unify remote views without bandwidth strain.
Pro Moves for Data Dominance
- Overlay trend lines on bars for dual-axis storytelling, unpacking correlations crisply.
- Leverage build paths to unveil filters, guiding audiences through query logic.
- Tag elements for searchability in large decks, streamlining revisits.
BI specialists use these to demo tools, converting skeptics by showcasing intuitive depth.
Smooth Sailing: Setup to Spotlight
The .key import unfolds categorized assets - charts grouped for rapid assembly. Masters propagate updates deck-wide, ideal for version controls.
A startup CFO credited pivot tables for nailing a funding pitch, distilling burn rates into digestible arcs that sealed the deal.
Chart your course with clarity - download the Business Analytics Keynote Template for $22 and let data lead the way.
Frequently Asked Questions
What diagram types suit analytics?
From Gantt for projects to Sankey for flows, all geared for business metrics.
For solo analysts or teams?
Both - easy solos, with shareable masters for collaborative polishes.
Color customization depth?
Seven bases, plus per-element tweaks for nuanced palettes.
Integration with data sources?
Native to Keynote, with easy CSV/Tableau embeds.
Animation for dashboards?
Yes, phased reveals to pace complex multi-panel views.
Package details?
.key with 28 diagrams, three masters, backgrounds, and schemes.