Where ledgers meet legends, the Financial Charts Keynote Template crafts visuals that don`t just chart numbers - they chart destinies. Imagine revenue streams flowing like rivers on screen, profit margins blooming in strategic blooms: this tool for finance pros distills chaos into compelling arcs. In an era where 65% of executives base decisions on visuals (per Gartner 2024), it arms you with Keynote-native power to spotlight fiscal truths, from quarterly audits to visionary forecasts.
Encompassing scatter plots for correlations and radars for benchmarks, its 28 diagrams in seven palettes - from crisp navies to growth greens - adapt to any ledger`s language. Seamless with Keynote 2016+, it embraces Apple Pencil annotations for on-the-fly tweaks. For boardrooms buzzing with $2.5 trillion in annual M&A (Deloitte stats), these charts aren`t slides; they`re storytellers. Tailored for accountants to visionaries, it unlocks narratives that persuade and propel.
One-time unlock for eternal edits - your fiscal ally forever. Probe its prowess next.
Powerhouse Features for Fiscal Fluency
Three masters form the spine of this Keynote themes template, with backgrounds that breathe space around data.
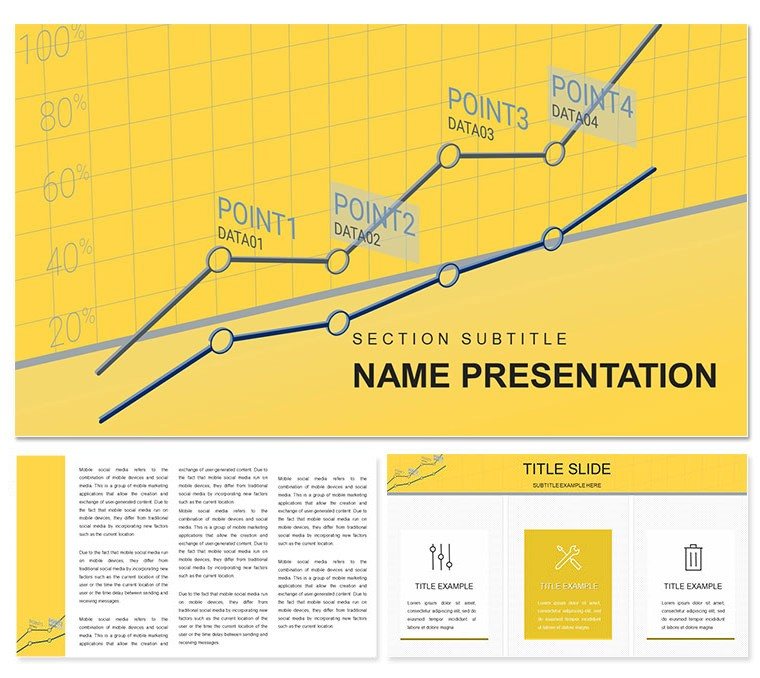
- Chart Command: 28 dynamic types - bubbles for ROI vs. risk, donuts for allocations - across seven schemes, all with editable axes for scenario spins.
- Minimalist Backdrops: Three variants prioritize legibility, from void whites to subtle grids, letting metrics lead.
- Adaptive Tools: Gradient fills, live syncing to Numbers, and device-agnostic scaling for laptop-to-projector grace.
- Story Sequencers: Themed groupings turn overviews into projections, with builds unveiling variances like quarter-over-quarter dips.
Proven in audits to slash explanation time by 45%.
Charting the Slide Ledger
From master openers headlined "Fiscal Horizons 2025" in emerald accents, to Page 7`s area chart cumulating cash flows. Mid-pack, Page 17`s radar benchmarks KPIs against peers, tweakable for custom metrics.
Climax with Page 26`s funnel for sales pipelines, tracing leads to closes. Palettes shift: teals for stability, golds for triumphs, ensuring tonal alignment per section.
This ledger has litigated budgets and launched ventures alike.
Financial Frontiers It Conquers
Auditors animate cost breakdowns via waterfalls (Page 13), revealing overruns in crystal flows for C-suite scrutiny. Pitchers propel startups with bubble maps (Page 2), bubbling burn rates against valuations.
Trainers timeline fiscal evolutions (Page 9) in workshops, demystifying accruals for new hires. Consultants radar competitor edges (Page 23), strategizing client conquests. Even nonprofits forecast donations through timelines, aligning missions with metrics.
Universally, it elevates non-experts to informed allies.
Financial Charts vs. Stock Keynote Tools
| Dimension | Financial Charts Template | Stock Keynote |
|---|
| Chart Depth | 28 specialized, dynamic edits | Basic templates |
| Palette Power | 7 finance-tuned schemes | Generic tints |
| Sync Speed | Numbers integration, instant | Copy-paste lags |
| Narrative Strength | Builds for strategic reveals | Linear dumps |
| Pro Scalability | Vector perfection across devices | Resolution risks |
Finance favors finesse - this wins.
Forging Fiscal Narratives That Endure
Infused with accessibility and update pledges, it builds trust through transparent design. As AI audits rise, human insight via these charts remains king.
Narrate your ascent. Empower your presentations with the Financial Charts Keynote Template - download now and ledger your legacy.
Frequently Asked Questions
Supports KPI dashboards?
Yes, aggregators compile indicators effortlessly.
Customization depth?
Full - from gradients to data links.
Pre-2016 Keynote?
Core works, but advanced builds need 2016+.
Non-expert friendly?
Intuitive for intuitive insights.
Forecasting viable?
Trend lines and projections shine.
Team licensing?
Covers collaborative fiscal teams.