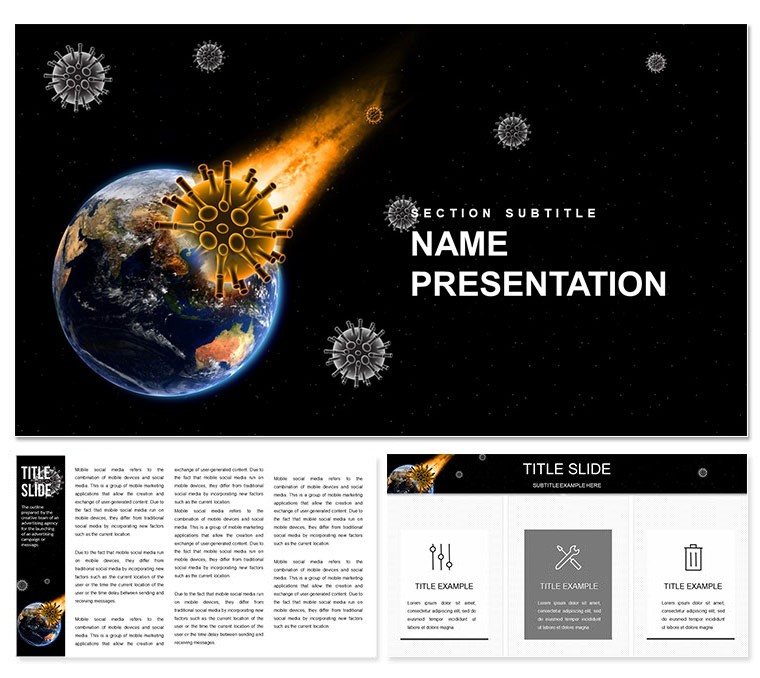
When the world faces invisible threats, your presentation must cut through the noise with stark clarity and urgent empathy. The Viruses and Pandemics on Earth Keynote Template rises to this call, arming medical professionals and global strategists with 28 evocative diagrams that map outbreaks from epicenters to containment. Featuring a dramatic backdrop of viral assaults on our planet, this template's three masters and backgrounds channel gravity - literally - into your message. Seven color schemes, from stark reds for alerts to muted grays for reflective analyses, ensure your deck adapts to tones from crisis briefings to policy roundtables.
Launch with a globe-centric slide where contagion vectors radiate like solar flares, customizable to trace real trajectories such as early COVID spreads. Or layer a timeline of historical pandemics, editable milestones pinpointing interventions that bent curves downward. Designed for pharma researchers dissecting mutation paths or business leaders in supply chain resilience, this tool turns dread into direction, fostering informed dialogues over fear.
Essential Features for Compelling Health Narratives
Impact starts with intentional design. Masters range from orbital views for macro overviews, zonal maps for regional focuses, and clustered nodes for symptom networks - each a launchpad for your data.
- 28 Thematic Diagrams: Epidemic curves, transmission trees, and impact matrices, all primed for statistical overlays.
- Seven Adaptive Schemes: High-contrast for projections, desaturated for retrospectives to evoke measured response.
- Three Evocative Backgrounds: Fractured earth textures, viral particle swirls, or containment barrier motifs.
- Dynamic Editables: Animate propagations to simulate spread models, with scalable vectors for zoomed details.
Flawless in Keynote, integrate GIS layers for geo-specific risks, streamlining from draft to dissemination.
Strategic Use Cases in Crisis and Prevention
Pharma teams modeling vaccine efficacy could harness bubble plots sizing populations by exposure risk, bubbling priorities for trials. Global business continuity planners might sequence disruption cascades via flowchart slides, linking factory halts to economic ripples.
In academic forums, construct comparative overlays of past plagues like Spanish Flu against modern vectors, highlighting lessons in resilience. For NGO reports, employ radial gauges for resource allocations, radially expanding aid flows.
Phased Approach: Structuring Your Pandemic Deck
- Frame the Threat: Assess scope - local or global - selecting aligned diagrams for context.
- Base Build: Set master and scheme, inputting baseline metrics like R0 values.
- Develop Layers: Add progression slides (e.g., slide 14 for mitigation stages), annotating turning points.
- Infuse Motion: Animate waves to depict peak flattenings, calibrating speeds for emphasis.
- Finalize Impact: Balance with hope-forward closes, exporting for multi-platform access.
This method trumps blank canvases by embedding health-specific scaffolds, accelerating to actionable outputs.
Guidance from Frontlines: Sharpening Delivery
Weave humanity in - pair stark stats with survivor icons to ground abstractions. For international crowds, multilingual overlays via text fields broaden reach. Inspired by WHO briefings, prioritize phased reveals: Threat, response, horizon - to guide emotional arcs.
Dodge fatigue by interspersing breathers; use fade-ins for heavy data, sustaining focus amid gravity.
Layered Assets for Nuanced Storytelling
Icons evoke masks to genomes, layouts from concentric for cycles to linear for chronologies. In policy pitches, Sankey streams channel intervention funds, streaming outcomes transparently.
Command attention - acquire the Viruses and Pandemics on Earth Keynote Template for $22 and chart courses through uncertainty.
Frequently Asked Questions
How do diagrams aid outbreak modeling?
Pre-scaled for SIR frameworks, they facilitate rapid simulations of susceptible-infected-recovered dynamics.
Customization for specific viruses?
Tailor via color-coded paths and icon swaps to denote strains like variants of concern.
Integration with external data?
Link to APIs for live case tallies, auto-refreshing visuals in real-time.
Suitability for educational use?
Yes, simplified modes via layer toggles make complex models accessible for students.
Animation best practices?
Align to narrative beats - slow builds for escalations, quick pulses for alerts.