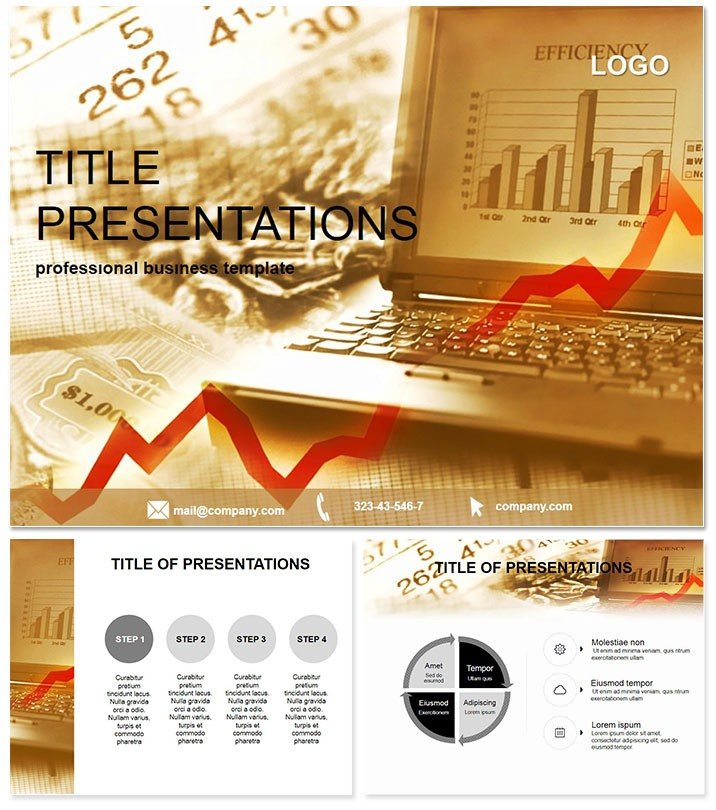
As someone who's crafted quarterly briefings for C-suite leaders at mid-sized firms and walked through audit findings with skeptical board members, I can tell you that nothing derails a financial discussion faster than cluttered visuals or mismatched data flows. That's why I turn to templates like this one every season - it's my go-to for turning dense spreadsheets into digestible narratives that stick. This financial report Keynote template isn't just a slide deck; it's a precision tool built for professionals who need to convey fiscal health without the fluff. With 28 targeted diagrams, it handles everything from balance overviews to compliance checklists, all optimized for Keynote 2016 and beyond.
I've used it to prep earnings calls where stakeholders demanded granular insights, and it consistently cuts my prep time in half while boosting comprehension. Imagine presenting a cash flow cascade that updates in real-time as projections shift - no manual tweaks mid-meeting. Or layering in ratio radars that highlight operational efficiencies at a glance. This template enforces a structure that's both rigorous and flexible, letting you focus on the story behind the numbers rather than wrestling with design. In an era where remote audits and virtual boardrooms are the norm, having a deck that renders flawlessly on any Mac ensures your message lands with authority, every time.
What sets this apart is its foundation in real-world fiscal workflows. Drawing from standards I've seen in Big Four reviews and internal compliance pushes, it incorporates masters with built-in audit headers and balance footers - elements that scream professionalism without you lifting a finger. Pair that with seven neutral color schemes, from stark grays for regulatory filings to subtle blues that evoke stability, and you've got a canvas that adapts to your brand or the board's preferences. It's not about flashy animations; it's about vectors that scale crisply and formulas that auto-sync with your source data. For me, that's the difference between a report that's filed away and one that sparks decisions.
Mastering the Core Diagrams: A Slide-by-Slide Blueprint
Diving into the heart of this template, each of the 28 slides serves a distinct role in unpacking financial narratives. Start with Slide 1's balance overview - a clean radial chart that aggregates assets, liabilities, and equity in a single, scannable view. I've layered client-specific data here to kick off investor updates, and it always prompts the right questions early.
By Slide 4, the cash flow cascade takes over, visualizing inflows and outflows as interconnected streams. This one's a lifesaver for liquidity discussions; in one treasury review, it helped us trace a seasonal dip back to vendor terms without burying the audience in tables. Slide 8 shifts to the P&L pyramid, stacking revenues down to net profit with tapered layers that emphasize margins - perfect for those high-stakes earnings slides where every percentage point counts.
Don't overlook Slide 10's animated accruals timeline, which sequences deferred items across quarters. It's subtle but powerful; I once used it to illustrate accrual impacts during a merger diligence, turning potential red flags into proactive talking points. Further in, Slide 14's audit trail tree branches out compliance paths, making it easy to map controls and risks hierarchically. This slide alone has saved hours in SOX prep sessions I've led.
Slide 15 stands out for table integration, blending editable grids with surrounding visuals for hybrid data dumps - like embedding trial balances amid trend lines. Then there's Slide 19's ratio radars, plotting metrics like ROE and debt-to-equity on polar axes for quick health scans. I've deployed these in advisory pitches to underscore portfolio strengths, often leading to immediate follow-ups.
Wrapping the analytical core, Slide 23's trend timelines forecast trajectories with smooth curves and markers, ideal for sensitivity analyses. Slide 26 compiles compliance checklists into a modular grid, while the final Slide 28 delivers a summary ledger that consolidates key takeaways. Each diagram is extensible - swap in your data, tweak the vectors, and it reforms without breaking. This isn't a rigid set; it's a modular engine for fiscal storytelling.
Seamless Workflow: Integrating into Your Daily Grind
In my routine, this template slots right into the tools I rely on - exporting from QuickBooks or Excel into Keynote with drag-and-drop ease, then syncing via iCloud for team feedback. The auto-update formulas mean linking to live sheets keeps everything current, even during last-minute revisions before a client call. I've built entire audit packages this way, collaborating with remote colleagues who drop in annotations without disrupting the layout.
For educators prepping case studies or consultants mocking up scenario models, the lifetime license means it's always ready - no recurring fees eating into budgets. And with full macOS compatibility, it plays nice with presentation remotes and screen-sharing apps, ensuring smooth delivery whether you're in a conference room or on a Zoom grid. The subtle grid backgrounds and ledger-inspired motifs add a layer of thematic cohesion that elevates the mundane into something boardroom-worthy.
Real-World Scenarios: From Boardrooms to Lecture Halls
Picture a finance director at a manufacturing outfit facing quarterly close. Using this template, they populate the P&L pyramid with plant efficiencies, then animate the accruals slide to show inventory write-downs - turning a routine report into a strategic pivot point that greenlights capex. I've facilitated similar sessions, where the visual clarity diffused tension and aligned execs on cost controls.
For startup founders pitching VCs, Slide 19's ratio radars become the hero, benchmarking burn rates against peers in a compact, compelling format. One entrepreneur I coached landed seed funding after we customized the trend timelines to project runway extensions, making abstract forecasts feel tangible. In consulting gigs, auditors leverage the audit trail tree to dissect vendor contracts, presenting findings that not only satisfy compliance but uncover savings opportunities.
Educators in business schools swear by it too - professors I've networked with use the compliance checklists for capstone projects, teaching students to build defensible arguments through structured visuals. And for non-profit treasurers, the balance overview slide simplifies donor reports, highlighting impact metrics without jargon overload. Across these contexts, the template's neutrality shines: adapt the color schemes to match org charts or regulatory palettes, and it fits like a custom suit.
Industry Applications: Tailored for Finance Pros Everywhere
In banking, this shines for stress-test simulations, where the cash flow cascade models interest rate shocks. Healthcare admins deploy it for reimbursement breakdowns, using table integrations to juxtapose claims data with revenue forecasts. Tech CFOs appreciate the extensible diagrams for SaaS metrics - plot MRR growth on timelines that scale with hyper-growth phases.
Even in government finance, where transparency is paramount, the audit trail tree maps budgetary controls, ensuring public-facing decks meet FOIA standards. Retail analysts use ratio radars to dissect seasonal variances, while energy sector planners forecast capex via animated accruals. No matter the vertical, this template bridges raw data to executive insights, fostering decisions that drive bottom lines.
Why This Beats the Defaults: A Quick Comparison
Standard Keynote charts are functional but forgettable - basic bars and pies that demand constant reformatting. This template embeds finance-specific logic from the start, with pre-built masters that enforce consistency. Here's how it stacks up:
| Feature | Default Keynote | This Financial Template |
|---|
| Diagram Variety | Generic shapes, manual builds | 28 specialized (cascades, pyramids, radars) |
| Data Linking | Basic copy-paste | Auto-update formulas for live sync |
| Customization | From scratch each time | 7 color schemes, extensible vectors |
| Compliance Aids | None built-in | Audit headers, checklists, trails |
| Collaboration | Standard iCloud | Seamless with thematic cohesion |
Against free alternatives like Google Slides add-ons, it offers deeper macOS integration and vector precision that doesn't pixelate on high-res displays. PowerPoint users might envy the native Apple fluidity, but this one's Keynote-exclusive edge makes it indispensable for Mac-centric teams. Upgrading means ditching the DIY drudgery for decks that command respect.
Ready to transform your next fiscal review? This template equips you with the tools to do just that.
Frequently Asked Questions
Is this template fully compatible with older versions of Keynote?
No, it's optimized for Keynote 2016 and later versions, ensuring all animations and formulas perform smoothly on modern macOS setups. If you're on an earlier build, consider updating for the best experience.
How customizable are the color schemes?
With seven pre-set schemes ranging from neutral grays to trust-building blues, you can swap them globally or per slide. Vectors allow infinite tweaks to match your firm's palette without losing structural integrity.
Can I use this for team collaborations?
Absolutely - iCloud integration lets multiple users edit in real-time, with the template's masters preserving formatting during merges. It's ideal for distributed audit teams.
What's included in the full version?
The full package delivers three masters, three backgrounds, all 28 diagrams, and the seven color schemes, giving you a complete toolkit for comprehensive reports.
Does it support data import from Excel?
Yes, auto-update formulas link directly to Excel sheets, pulling in balances or projections dynamically so changes reflect instantly in your slides.
How does the lifetime license work?
One-time purchase grants unlimited personal and firm use, with no expirations or seat limits - update your decks year after year without additional costs.
Streamline your financial storytelling today - grab this template and watch your presentations gain the edge they deserve.