Health - Wellness PowerPoint templates
These templates provide structured layouts for health and wellness presentations, giving HR professionals and wellness coordinators the framework to focus on data storytelling rather than slide design.
When an HR director at a tech company needs to present quarterly wellness program results to the leadership team, the challenge isn't the content - it's making sure the visual hierarchy supports the key claims without hours of tweaking.
This collection focuses on presentation structure that aligns metrics with actionable recommendations across every slide.
Download any template to get started with pre-aligned charts and consistent branding elements.
 (16)
(16) Free Digital Marketing PowerPoint Template: Ignite Your Campaigns with Visual ImpactID: #PP03987$10.00
 (10)
(10) Fruit Cocktail PowerPoint Template - 28 Editable Health Diagrams | Instant DownloadID: #PP03953free
 (11)
Berry PowerPoint Template: Fresh Takes on Healthy Eating PresentationsID: #PP03952$10.00
(11)
Berry PowerPoint Template: Fresh Takes on Healthy Eating PresentationsID: #PP03952$10.00 (328)
Citrus Fresh PowerPoint Template: Zest Up Your PresentationsID: #PP03912$8.00
(328)
Citrus Fresh PowerPoint Template: Zest Up Your PresentationsID: #PP03912$8.00 (45)
Tropical Breeze PowerPoint Template: Ride the Wave of Engaging SlidesID: #PP03911$10.00
(45)
Tropical Breeze PowerPoint Template: Ride the Wave of Engaging SlidesID: #PP03911$10.00 (155)
Healthy Living PowerPoint TemplateID: #PP03892free
(155)
Healthy Living PowerPoint TemplateID: #PP03892free (232)
Dentistry Healthy Teeth PowerPoint Template: Smile-Worthy SlidesID: #PP03764$12.00
(232)
Dentistry Healthy Teeth PowerPoint Template: Smile-Worthy SlidesID: #PP03764$12.00 (100)
(100) Spa Procedures PowerPoint Template: Wellness DeckID: #PP03745$12.00
 (631)
Spa Pedicure Treatment PowerPoint Template: Rejuvenate Your Wellness PitchID: #PP03742$12.00
(631)
Spa Pedicure Treatment PowerPoint Template: Rejuvenate Your Wellness PitchID: #PP03742$12.00 (124)
Spa Treatments for Hands and Feet PowerPoint Template: Pamper Your AudienceID: #PP03741$10.00
(124)
Spa Treatments for Hands and Feet PowerPoint Template: Pamper Your AudienceID: #PP03741$10.00 (796)
Sole Soothe SPA Foot Treatment PowerPoint Template: Step into SerenityID: #PP03740$12.00
(796)
Sole Soothe SPA Foot Treatment PowerPoint Template: Step into SerenityID: #PP03740$12.00 (571)
DIY Natural Face Mask PowerPoint Template: Blend Beauty from Your KitchenID: #PP03735$12.00
(571)
DIY Natural Face Mask PowerPoint Template: Blend Beauty from Your KitchenID: #PP03735$12.00 (1084)
 Vibrant Beauty Makeup PowerPoint TemplateID: #PP03734$12.00
 (415)
Cosmetic Brushes Accessories PowerPoint TemplateID: #PP03733$12.00
(415)
Cosmetic Brushes Accessories PowerPoint TemplateID: #PP03733$12.00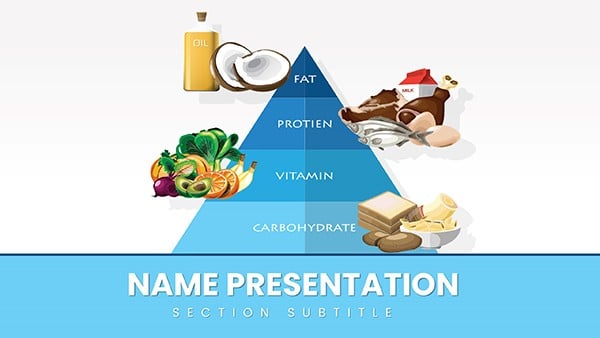 (1126)
Healthy Food Pyramid PowerPoint Template: Stack Wellness WiselyID: #PP03719$12.00
(1126)
Healthy Food Pyramid PowerPoint Template: Stack Wellness WiselyID: #PP03719$12.00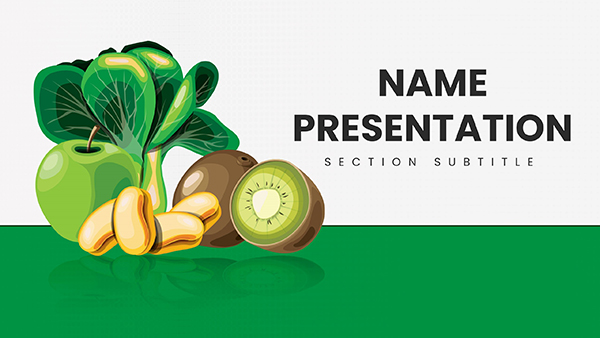 (1070)
Vitamin K Health PowerPoint Template EssentialsID: #PP03686$10.00
(1070)
Vitamin K Health PowerPoint Template EssentialsID: #PP03686$10.00 (439)
Vitamin E Rich Foods PowerPoint TemplateID: #PP03685$12.00
(439)
Vitamin E Rich Foods PowerPoint TemplateID: #PP03685$12.00 (785)
Vitamin C Supplement PowerPoint TemplateID: #PP03683$10.00
(785)
Vitamin C Supplement PowerPoint TemplateID: #PP03683$10.00 (802)
Vitamin B Foods PowerPoint TemplateID: #PP03682$10.00
(802)
Vitamin B Foods PowerPoint TemplateID: #PP03682$10.00 (989)
Vitamin A Carotenoids PowerPoint Template: Vitality Through VisualsID: #PP03680$12.00
(989)
Vitamin A Carotenoids PowerPoint Template: Vitality Through VisualsID: #PP03680$12.00 (756)
Nutrition Vitamin A PowerPoint Template: Fueling Informed DialoguesID: #PP03679$12.00
(756)
Nutrition Vitamin A PowerPoint Template: Fueling Informed DialoguesID: #PP03679$12.00 (1184)
Healthy Food PowerPoint Template: Ignite Wellness ConversationsID: #PP03676$12.00
(1184)
Healthy Food PowerPoint Template: Ignite Wellness ConversationsID: #PP03676$12.00 (873)
Fresh and Delicious Fruit PowerPoint Template: Harvest Insights with ZestID: #PP03675$12.00
(873)
Fresh and Delicious Fruit PowerPoint Template: Harvest Insights with ZestID: #PP03675$12.00 (676)
Healthy Muesli PowerPoint Template: Recipe MasteryID: #PP03634$12.00
(676)
Healthy Muesli PowerPoint Template: Recipe MasteryID: #PP03634$12.00 (928)
Makeup Wedding PowerPoint Template: Beauty That Brides DeserveID: #PP03450$12.00
(928)
Makeup Wedding PowerPoint Template: Beauty That Brides DeserveID: #PP03450$12.00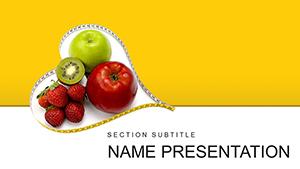 (679)
Fresh Fruit Diet PowerPoint Template: Harvest Health in Every SlideID: #PP03446$12.00
(679)
Fresh Fruit Diet PowerPoint Template: Harvest Health in Every SlideID: #PP03446$12.00 (789)
Weight Loss Fitness Exercises PowerPoint templateID: #PP03336$12.00
(789)
Weight Loss Fitness Exercises PowerPoint templateID: #PP03336$12.00 (246)
Fitness for Beginners PowerPoint templateID: #PP03293$12.00
(246)
Fitness for Beginners PowerPoint templateID: #PP03293$12.00 (1171)
Download Easy Homemade Pancakes Recipe PowerPoint Template, PPTID: #PP03204$10.00
(1171)
Download Easy Homemade Pancakes Recipe PowerPoint Template, PPTID: #PP03204$10.00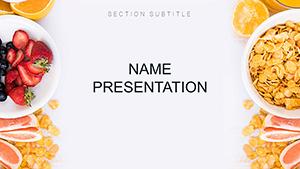 (287)
Healthy Eating for Weight Loss PowerPoint templateID: #PP03197$12.00
(287)
Healthy Eating for Weight Loss PowerPoint templateID: #PP03197$12.00 (575)
Cosmetics and Beauty Spa PowerPoint templateID: #PP03136$12.00
(575)
Cosmetics and Beauty Spa PowerPoint templateID: #PP03136$12.00 (1144)
Professional Diet and Healthy Food PowerPoint Template - Download NowID: #PP03135$12.00
(1144)
Professional Diet and Healthy Food PowerPoint Template - Download NowID: #PP03135$12.00 (430)
Healthy Lifestyle Tips PowerPoint templateID: #PP03094$12.00
(430)
Healthy Lifestyle Tips PowerPoint templateID: #PP03094$12.00
How These Templates Help Present Wellness Data Effectively
The layouts place the headline claim at the top, followed by supporting metrics in consistent columns and a clear call to action at the bottom. This built-in flow means an executive summary slide already carries the argument before you add a single number.
After the first major section.
Sports PowerPoint templates work well when your wellness program includes fitness challenges, while pie chart templates for Keynote handle sector breakdowns of budget allocation. If you want modern depth, 3D shape templates in PowerPoint add dimension to habit tracker visuals without extra effort.
The Hidden Time Sinks Avoided by Using Structured Wellness Slides
Building manually forces you to set the slide master for recurring headers, align column widths across 20 slides, match font sizes for every metric label, and lock a color palette that signals positive health outcomes. Those decisions alone consume the thinking time you need for refining the story before the C-suite review.
Four Business Situations Where These Templates Make an Immediate Difference
An HR director at a 500-employee firm has two days to deliver the annual wellness report to the board. The stakeholder wants clear ROI on gym subsidies and stress-reduction programs. With the template, the executive summary slide is already laid out with metric callouts and action bullets, so the focus shifts to tightening the narrative instead of fixing alignment.
A corporate wellness coach pitches a new mindfulness app integration to department heads. Abstract benefits need concrete visuals. The before-and-after comparison layout already exists, letting the coach spend time on impact numbers rather than creating comparison tables from scratch.
A nutritionist in a hospital setting updates cafeteria policy for 300 staff members. The operations manager needs quick visuals of food group breakdowns. The icon set for dietary categories is pre-grouped, so swapping items keeps proportions intact and the meeting stays on schedule.
A wellness-tech startup founder presents impact stats in a seed-round investor meeting. The action slide is pre-built to drive next steps. Instead of wrestling with chart colors at midnight, the founder rehearses the story that closes the round.
Workflow Advantages for Teams Sharing Wellness Content
For quarterly updates across departments, the slide master keeps KPI layouts identical. Any team member opens the file, replaces data via linked Excel tables, and the entire deck stays consistent without redesign. This approach scales when five regional offices all report the same wellness metrics each quarter.
Key Technical Setup for Consistent 16:9 Wellness Decks in PowerPoint
Open View > Slide Master and adjust the master layouts first for global changes to headers and footers. When linking health data from Excel, use Paste Special > Paste Link so numbers update automatically if the source file changes. For PDF export, embed fonts under File > Options > Save to keep terms like 'BMI' and 'VO2 max' rendering exactly as designed on every recipient's machine.
What Sets This Collection Apart for Real Corporate Storytelling
Every layout advances the argument with clear hierarchy instead of decorative padding. Editable shapes maintain proportion when you resize for your brand colors, and the absence of locked clipart means full control over every element in native PPTX format.
Browse the full collection and download the ones that fit your next presentation.
Are these templates compatible with Microsoft PowerPoint 2016 and newer versions?
Yes, all files use native PPTX format and open fully in PowerPoint 2016, 2019, and Microsoft 365. Charts and shapes remain editable, and the slide master carries over global styles. If you open in an older version, switch to compatibility mode; most 16:9 layouts and linked data features work, though advanced shape effects may require minor manual adjustment. Test the PDF export early to confirm embedded fonts travel correctly.
Can I share the downloaded files with my team for internal use?
The license permits full internal sharing within your organization for business presentations. Once downloaded, you own the editable PPTX files and can distribute edited versions across departments or offices. There is no watermark, and commercial use in client or board meetings is allowed. The only restriction is reselling the original templates themselves.
How do I update the slide master for custom company branding?
Go to View > Slide Master, select the top-level master slide, and change fonts, colors, or logo placeholders. All layout slides inherit these updates automatically. This is especially useful for wellness decks where you want every metric label to match your brand palette without editing 30 individual slides. Save the file after changes and the consistency carries through every future use.
What file format do I receive and how large are the downloads?
You receive a single PPTX file per template. File sizes stay under 5 MB even with multiple charts because icons and shapes use vector elements rather than high-resolution images. The download starts instantly after selection with no account or email required for these collections.
Do the templates include editable charts for health metrics?
Yes, every chart is built from native PowerPoint elements linked to placeholder data. Right-click any chart and choose Edit Data to open the embedded Excel sheet, replace numbers, and watch the visuals update while keeping your custom colors and labels intact. This works for line graphs tracking participation rates or bar charts showing ROI.