Food & Beverage PowerPoint templates
These templates contain layouts specifically structured for food and beverage presentations, covering everything from seasonal menu updates to performance reporting and client pitches. They are intended for business teams in the sector who want to spend their time on the message instead of adjusting column widths and font sizes.
Use them when a restaurant marketing manager needs to roll out new dish options to franchise partners or when a beverage brand lead prepares an update for the executive team ahead of a trade show.
Consider a finance director at a food production company assembling the budget presentation for the CFO. The deadline was tight and the data included cost breakdowns across ingredients. The template ensured the executive summary slide led with key claims, supported by data visuals that stayed consistent across the deck.
Select the file that aligns with your next meeting and open it in PowerPoint to begin.
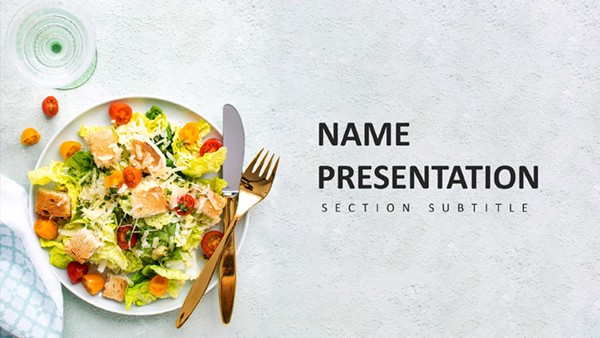 (8)
(8) Trendy Foods PowerPoint Template: Plate Up Presentations That WowID: #PP04002$10.00
 (15)
Dinner Recipes PowerPoint Template: Craft Culinary MasterpiecesID: #PP03963$10.00
(15)
Dinner Recipes PowerPoint Template: Craft Culinary MasterpiecesID: #PP03963$10.00 (10)
Fruit Cocktail PowerPoint Template - 28 Editable Health Diagrams | Instant DownloadID: #PP03953free
(10)
Fruit Cocktail PowerPoint Template - 28 Editable Health Diagrams | Instant DownloadID: #PP03953free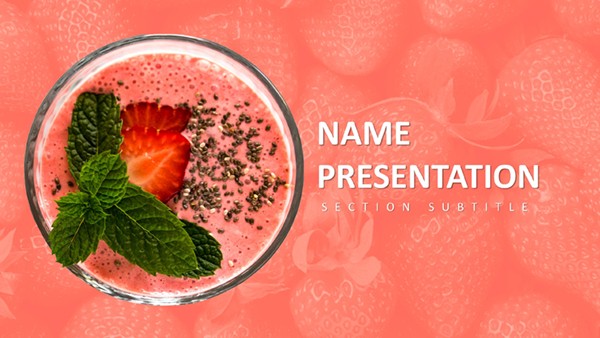 (11)
Berry PowerPoint Template: Fresh Takes on Healthy Eating PresentationsID: #PP03952$10.00
(11)
Berry PowerPoint Template: Fresh Takes on Healthy Eating PresentationsID: #PP03952$10.00 (328)
Citrus Fresh PowerPoint Template: Zest Up Your PresentationsID: #PP03912$8.00
(328)
Citrus Fresh PowerPoint Template: Zest Up Your PresentationsID: #PP03912$8.00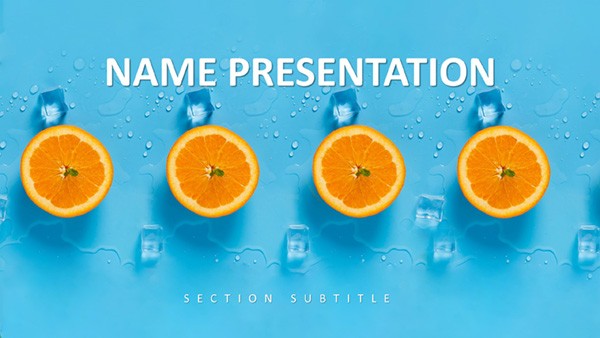 (45)
Tropical Breeze PowerPoint Template: Ride the Wave of Engaging SlidesID: #PP03911$10.00
(45)
Tropical Breeze PowerPoint Template: Ride the Wave of Engaging SlidesID: #PP03911$10.00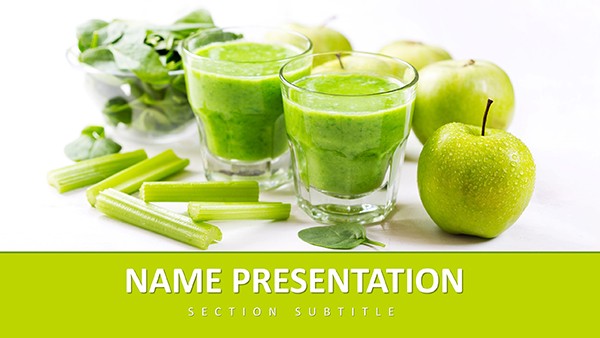 (155)
Healthy Living PowerPoint TemplateID: #PP03892free
(155)
Healthy Living PowerPoint TemplateID: #PP03892free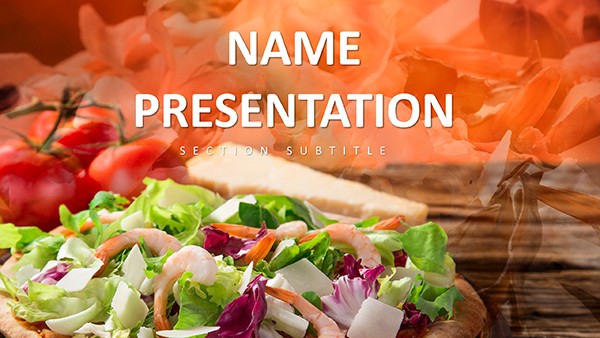 (339)
(339) Food Industry PowerPoint TemplateID: #PP03884$10.00
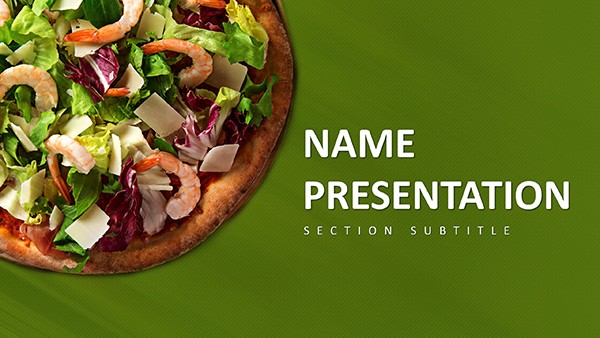 (366)
Pizza-Perfect PowerPoint Template: Slice Through Boring PresentationsID: #PP03883free
(366)
Pizza-Perfect PowerPoint Template: Slice Through Boring PresentationsID: #PP03883free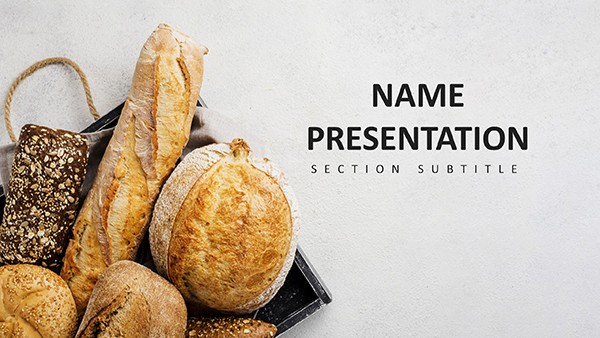 (6)
(6) Bakery PowerPoint TemplateID: #PP03814$12.00
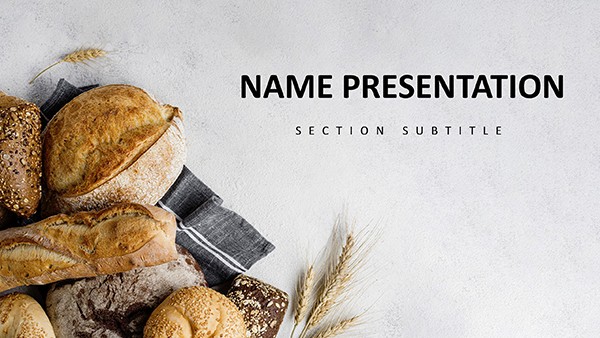 (979)
Bakery Bread and Bread Rolls PowerPoint Template: PresentationID: #PP03813$12.00
(979)
Bakery Bread and Bread Rolls PowerPoint Template: PresentationID: #PP03813$12.00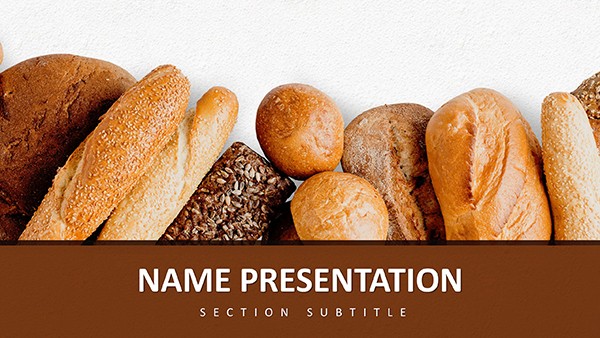 (29)
(29) Bread and Bread Rolls PowerPoint TemplateID: #PP03812$12.00
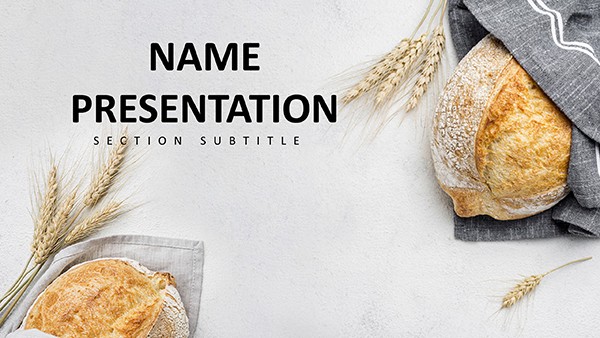 (522)
Mouthwatering Baking PowerPoint TemplateID: #PP03811$12.00
(522)
Mouthwatering Baking PowerPoint TemplateID: #PP03811$12.00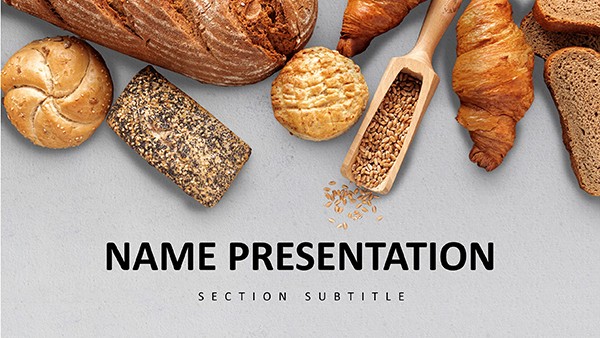 (859)
Delicious and Easy Baking Recipes PowerPoint TemplateID: #PP03810$12.00
(859)
Delicious and Easy Baking Recipes PowerPoint TemplateID: #PP03810$12.00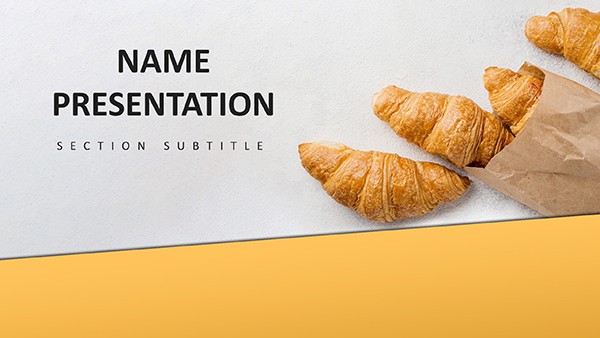 (857)
Croissant PowerPoint Template for Bakery ProsID: #PP03809$12.00
(857)
Croissant PowerPoint Template for Bakery ProsID: #PP03809$12.00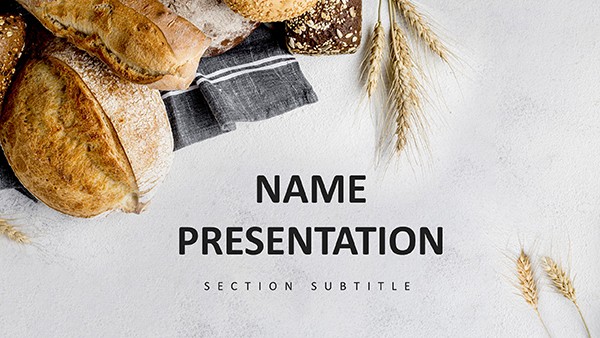 (1141)
Baking Bread PowerPoint Template: PresentationID: #PP03808$12.00
(1141)
Baking Bread PowerPoint Template: PresentationID: #PP03808$12.00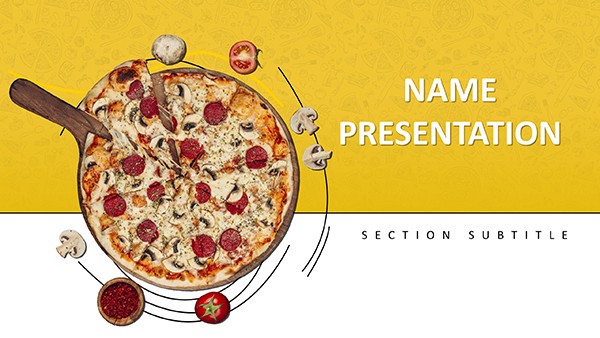 (416)
Pizza Recipe PowerPoint Template for ChefsID: #PP03807$12.00
(416)
Pizza Recipe PowerPoint Template for ChefsID: #PP03807$12.00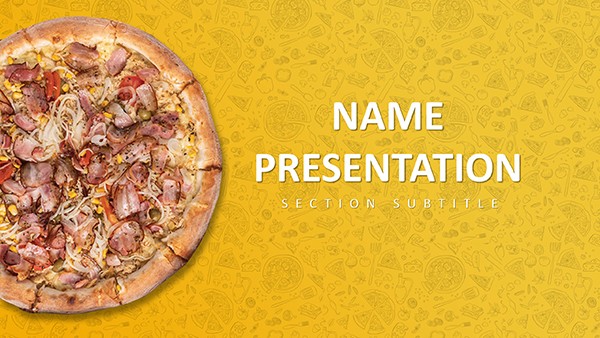 (312)
Menu Pizza PowerPoint Template: PresentationID: #PP03806$12.00
(312)
Menu Pizza PowerPoint Template: PresentationID: #PP03806$12.00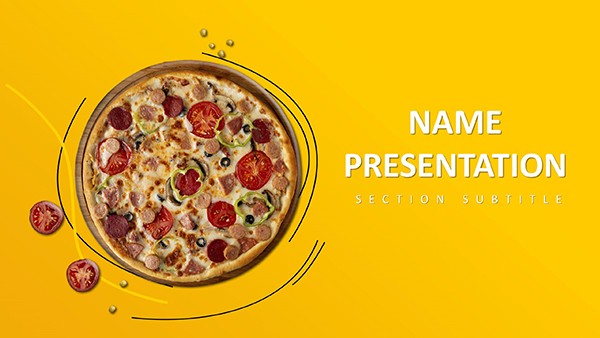 (1180)
Creative Pizza PowerPoint Template for PresentationsID: #PP03805$12.00
(1180)
Creative Pizza PowerPoint Template for PresentationsID: #PP03805$12.00 (662)
Delectable Pizza PowerPoint TemplateID: #PP03804$12.00
(662)
Delectable Pizza PowerPoint TemplateID: #PP03804$12.00 (710)
Vegetarian Pizza PowerPoint TemplateID: #PP03803$10.00
(710)
Vegetarian Pizza PowerPoint TemplateID: #PP03803$10.00 (562)
Delicious Pizza PowerPoint Template for PresentationsID: #PP03802$10.00
(562)
Delicious Pizza PowerPoint Template for PresentationsID: #PP03802$10.00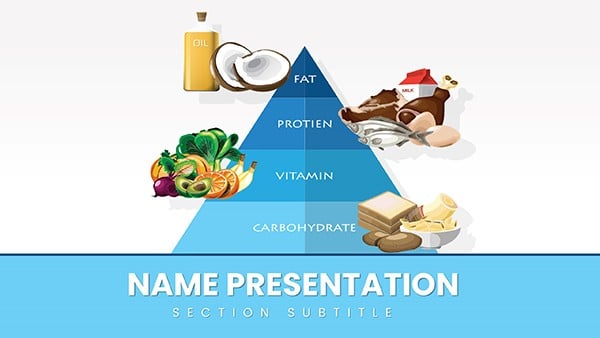 (1126)
Healthy Food Pyramid PowerPoint Template: Stack Wellness WiselyID: #PP03719$12.00
(1126)
Healthy Food Pyramid PowerPoint Template: Stack Wellness WiselyID: #PP03719$12.00 (439)
Vitamin E Rich Foods PowerPoint TemplateID: #PP03685$12.00
(439)
Vitamin E Rich Foods PowerPoint TemplateID: #PP03685$12.00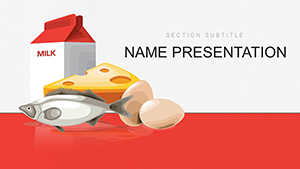 (319)
Vitamin D Foods PowerPoint TemplateID: #PP03684$12.00
(319)
Vitamin D Foods PowerPoint TemplateID: #PP03684$12.00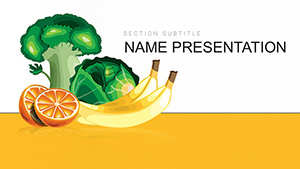 (785)
Vitamin C Supplement PowerPoint TemplateID: #PP03683$10.00
(785)
Vitamin C Supplement PowerPoint TemplateID: #PP03683$10.00 (802)
Vitamin B Foods PowerPoint TemplateID: #PP03682$10.00
(802)
Vitamin B Foods PowerPoint TemplateID: #PP03682$10.00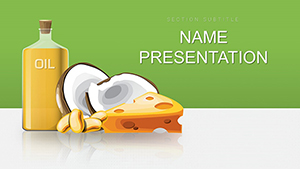 (896)
Fats & Oils PowerPoint Template: Elevate Your Nutrition NarrativesID: #PP03677$12.00
(896)
Fats & Oils PowerPoint Template: Elevate Your Nutrition NarrativesID: #PP03677$12.00 (1184)
Healthy Food PowerPoint Template: Ignite Wellness ConversationsID: #PP03676$12.00
(1184)
Healthy Food PowerPoint Template: Ignite Wellness ConversationsID: #PP03676$12.00 (873)
Fresh and Delicious Fruit PowerPoint Template: Harvest Insights with ZestID: #PP03675$12.00
(873)
Fresh and Delicious Fruit PowerPoint Template: Harvest Insights with ZestID: #PP03675$12.00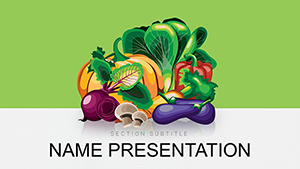 (1060)
Vegetables and Greengrocery PowerPoint Template: Root Your Ideas in Fresh DesignID: #PP03674$12.00
(1060)
Vegetables and Greengrocery PowerPoint Template: Root Your Ideas in Fresh DesignID: #PP03674$12.00 (1075)
Food Products PowerPoint Template: Simmer Stories of Culinary ExcellenceID: #PP03673$12.00
(1075)
Food Products PowerPoint Template: Simmer Stories of Culinary ExcellenceID: #PP03673$12.00 (676)
Healthy Muesli PowerPoint Template: Recipe MasteryID: #PP03634$12.00
(676)
Healthy Muesli PowerPoint Template: Recipe MasteryID: #PP03634$12.00
How Food and Beverage Presentations Differ from Generic Business Decks
The food and beverage sector demands a different kind of visual language. Slides must showcase products in an appetizing way while still conveying hard metrics like margin percentages or inventory turnover. Layouts need to balance large images of dishes with text that explains sourcing or compliance details. These templates start with that balance already in place so the first slide sets the tone for the entire deck.
What Holds Teams Back from Using Niche Templates
Many hesitate because they worry the designs won't match their brand colors or that editing will break the layout when adding their own photos. Others assume the files are too rigid for the specific data they track, such as seasonal fluctuations in ingredient costs. The truth is these layouts are built with editable shapes and placeholders that adapt without losing the overall hierarchy.
Real-World Applications Across the Food and Beverage Sector
A restaurant general manager in a competitive city market had only 48 hours to prepare the quarterly performance review for the ownership group. Sales figures showed a dip in beverage revenue during off-peak hours and the team needed to propose new promotions. The template placed the executive summary at the top followed by supporting charts, allowing the manager to focus on the action plan rather than spending time matching font sizes across 15 slides.
A beverage distributor account executive faced a key buyer meeting with a national supermarket chain. The goal was to highlight three new product lines with taste profiles and projected shelf space impact. Before the template the executive would spend hours aligning product photos and data tables; after using the file the presentation flowed naturally from introduction to pricing comparison, leaving more time to rehearse the delivery.
In a food manufacturing plant the operations director needed to present the annual safety and compliance update to the board. The deck included regulatory charts and before-after process visuals. The structured layout kept all sections consistent so the board could follow the narrative from risk identification to mitigation steps without distraction from inconsistent slide designs.
Finally, the marketing lead at a cafe chain prepared the new menu rollout training for 200 employees across locations. The presentation covered recipe changes and customer feedback data. With the pre-built hierarchy the lead could embed team photos and icons without alignment issues, ensuring the training session emphasized the why behind the changes rather than slide mechanics.
Choose the template that matches your upcoming deliverable and download it now to save setup time.
The Hidden Time Loss When Starting Slides from Scratch
Building a food and beverage deck manually means first selecting a font stack that pairs with food imagery without looking dated. Next comes creating the slide master to lock in header styles for 20 or more slides. Then chart palettes must be chosen to represent freshness rather than default corporate tones, and column widths for cost comparison tables have to be manually matched so they read cleanly in the meeting room. Each of these decisions pulls focus away from the core argument about market positioning or cost control.
The templates eliminate those upfront choices leaving the user free to insert their specific numbers and images.
Practical Advice for Managing Recurring Food and Beverage Decks
For teams that produce monthly sales reports or quarterly investor updates the slide master in these files ensures every new deck inherits the same visual standards. You can create a library of reusable reporting slides for inventory metrics that get updated each cycle. This approach keeps department-wide consistency even when different people contribute sections.
A non-obvious step is to group related placeholders on the master so that when you swap in new food photography the text blocks reflow automatically without manual nudging.
Key Technical Step Before Exporting Your Deck
Before sending the file to clients or the board check the aspect ratio setting on the slide master. These templates default to 16:9 but if your projector or shared screen uses 4:3 the images of menu items can appear stretched. Adjusting once on the master applies the change across all slides and preserves the embedded fonts during PDF export so the deck renders exactly as seen on screen.
What Makes This Collection Suited for Food and Beverage Teams
Unlike generic files that add decorative elements around the edges these templates prioritize data storytelling with space reserved for real metrics and product visuals. The editing freedom allows full control over shapes and charts while the intent behind each layout supports corporate storytelling rather than just filling slides. Users report that the absence of extra ornamentation lets the content about supply chains or customer trends take center stage.
Choosing the Right Category for Your Specific Needs
If your presentation needs extend beyond the food and beverage space consider exploring the business PowerPoint templates for broader strategy discussions. Teams working on product promotion campaigns often find value in the marketing PowerPoint templates that emphasize visual campaigns. For financial storytelling aimed at investors the investor pitch deck templates provide focused structures that complement the industry-specific options here.
If these layouts fit your workflow select the file that best matches your current project and start editing.
Frequently Asked Questions
Are these templates compatible with current versions of Microsoft PowerPoint?
Yes, every file is saved in PPTX format and has been tested on PowerPoint 2016 and all newer desktop versions including Microsoft 365 subscriptions. The slide master uses standard features so layouts remain intact when you add your own content. If you open the file in an older version like 2013 some advanced chart linking may require manual reconnection but the core text and image placeholders work without issue. Always test the PDF export after editing to confirm fonts render correctly on the recipient's device.
Can I import these templates into Apple Keynote?
The files are built in PPTX format so import into Keynote is possible but requires some manual adjustment to the master slide settings for full compatibility. Text and image placeholders transfer cleanly but chart behaviors may need tweaking to match Keynote's animation options. For the best experience we recommend using the native PowerPoint environment since the slide master and aspect ratio controls are optimized for its engine. If you must use Keynote test the exported PDF to ensure visual hierarchy holds.
How many team members can use a single downloaded file?
The license allows unlimited use within your organization for both internal meetings and client presentations. Team members can edit the same file simultaneously on shared drives or cloud storage without additional costs. This setup supports collaborative workflows common in food and beverage companies where multiple departments contribute to one deck. The only restriction is against redistributing the original template files outside your company.
Are the data charts editable for tracking metrics like food costs?
Yes, all charts use native PowerPoint elements with embedded sample data that you can replace directly or link to an external Excel file. Updates to sales figures or ingredient percentages automatically resize the visuals while keeping the color palette consistent with the rest of the deck. This feature is especially useful for recurring reports in the food and beverage industry where monthly numbers change frequently but the layout must stay the same.
What is the process for changing the slide aspect ratio?
The default is 16:9 which works for most modern screens and projectors. To switch to 4:3 open the slide master and go to page setup to change the ratio - the adjustment applies to every slide in the file. Placeholders for images and text reflow to prevent overlap and you should verify that food photography still displays without cropping. Save a separate version of the file before making this change to keep the original intact.
Is commercial use allowed when presenting to clients?
Yes, the templates can be used in any commercial context including client pitches and paid consulting work. You retain full rights to the customized decks you create but the original template files cannot be resold or shared publicly as standalone products. This gives agencies and in-house teams in the food and beverage space the flexibility to deliver high-quality presentations while maintaining focus on the client-specific content.