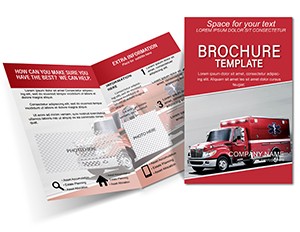
Draw Graph Brochure Template: Visualize Data with Precision
Type: Brochures template
Category: Business, Education & Training
Sources Available: .ait, .dotx, .indt
Product ID: BT01524
Imagine transforming dense data into digestible visuals that captivate your audience, whether you're pitching quarterly results to stakeholders or outlining training modules for a new team. The Draw Graph Brochure Template is designed for professionals in business and education who need to convey complex information without overwhelming readers. With its focus on essential elements - clean graphs, concise text blocks, and intuitive flow - this template ensures your message lands clearly and memorably. Tailored for those moments when every line graph or bar chart counts, it helps you highlight trends, comparisons, and projections in a format that's as professional as it is practical.
At its core, this brochure shines in scenarios like annual reports or workshop handouts, where visual storytelling turns numbers into narratives. You'll appreciate how the template's structure prioritizes readability: key sections unfold logically, guiding the eye from overview to details without unnecessary clutter. It's not just about looking good - it's about making your data work harder for you, fostering better decisions and engagement. Whether you're a consultant mapping client growth or an educator illustrating economic principles, this tool streamlines your workflow while amplifying impact.
Core Features That Drive Clarity
The Draw Graph Brochure Template packs thoughtful design choices into a versatile package. Start with the editable graph elements, which let you swap datasets seamlessly using familiar tools. No more wrestling with clunky defaults - these are pre-built for scalability, from simple pie charts to multi-axis line graphs that reveal patterns at a glance.
- Modular Layouts: Rearrange panels effortlessly to fit your story, whether emphasizing sales funnels or learning outcomes.
- Consistent Typography: Sans-serif fonts ensure legibility across print and digital, with hierarchy that draws attention to headlines and data labels.
- Vector Icons and Shapes: High-quality graphics for annotations, like arrows pointing to peaks or icons denoting categories, all fully customizable in color and size.
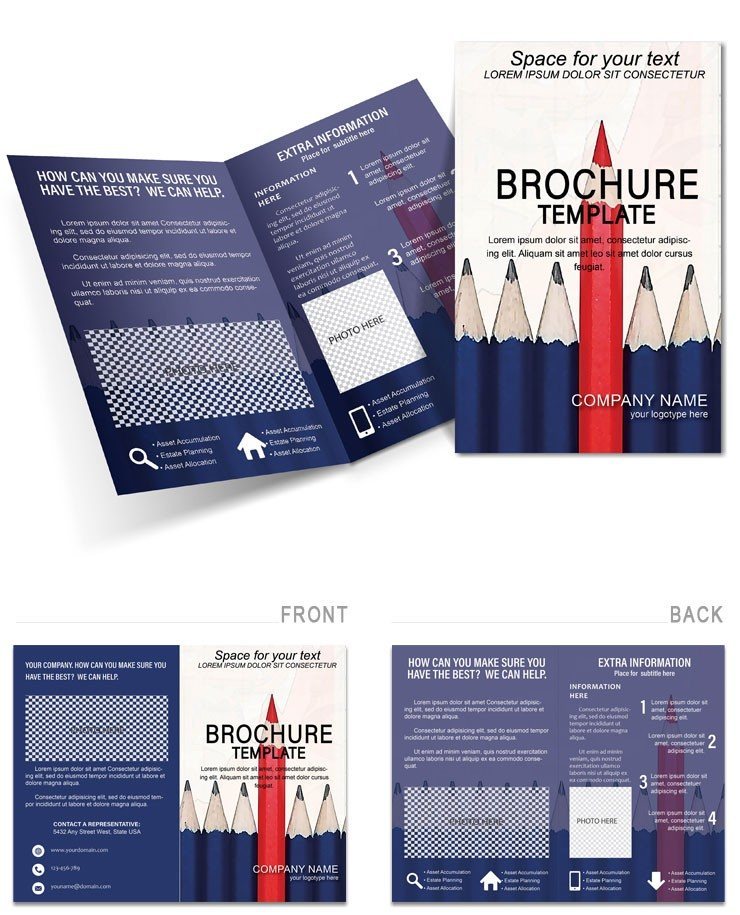
Beyond visuals, the template's half-fold format keeps content focused - front cover hooks with a bold graph teaser, inside spreads dive into specifics, and the back reinforces your contact details. It's compatible across Adobe Illustrator (.ait), InDesign (.indt), and even Microsoft Word (.dotx) for broader team access, making collaboration a breeze.
Integrating Graphs for Maximum Impact
To make the most of these features, begin by identifying your data's hero: that one insight everyone needs to remember. Layer it into the central graph panel, then use surrounding text boxes to explain variances - perhaps why Q2 dipped, backed by a simple callout bubble. This approach mirrors how top analysts at firms like McKinsey structure their decks, keeping explanations tied directly to the visual.
- Import your spreadsheet data into the graph tool within InDesign.
- Adjust scales and legends to avoid distortion - aim for even spacing that highlights outliers.
- Test print proofs to confirm colors hold true, especially for grayscale distributions.
Such steps not only save time but also build trust, as readers see evidence presented transparently.
Real-World Applications in Business and Training
For business leaders, this template excels in investor updates or product launches, where graphs bridge the gap between raw metrics and strategic vision. Picture a startup founder using it to chart user acquisition curves, turning potential skepticism into excitement with layered visuals that show trajectory over time. The logical progression - from problem statement via infographic to solution summary - mirrors proven communication frameworks, ensuring your pitch resonates.
In education and training, it's a game-changer for course overviews or certification guides. An instructor might adapt the inner panels to map curriculum milestones, with bar graphs tracking skill progression. This not only aids learners in self-assessment but also positions you as an organized expert. Consider how it fits into hybrid sessions: print for in-person, PDF for virtual, all while maintaining that polished edge.
One practical tip: Pair graphs with minimal text overlays, like "Growth: 15% YoY," to reinforce without redundancy. This keeps the brochure under 8 pages, ideal for quick scans during networking events or team huddles.
Customizing for Your Niche
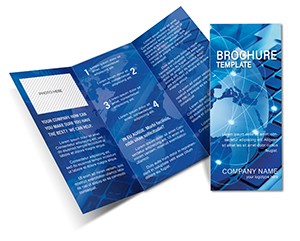
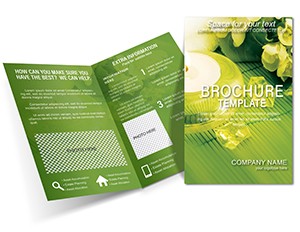
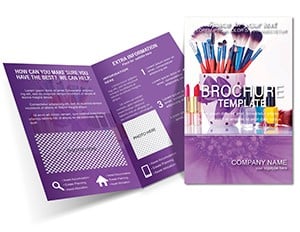
Adaptation is straightforward - swap the default blue-green palette for brand-aligned hues via the color swatches in Illustrator. Add your logo to the footer for instant recognition, and embed hyperlinks in digital versions for deeper dives into source data. For training-focused uses, incorporate QR codes linking to video demos, extending the brochure's life beyond the page.
Compared to starting from scratch in PowerPoint, this template cuts setup time dramatically, letting you focus on content refinement. It's especially valuable for small teams without dedicated designers, as the pre-set alignments prevent common pitfalls like skewed axes or mismatched fonts.
Streamlining Your Workflow with This Template
From download to distribution, the process is intuitive. After acquiring the files, open in your preferred software and populate placeholders with your assets. Use the master pages in InDesign for consistent updates across variants - say, one for sales and another for HR training. Export options cover everything from high-res PDFs for print shops to interactive SWFs for web embeds.
Users often overlook the bleed settings, but here they're preset for professional printers, ensuring edges crop cleanly. For digital tweaks, the layered PSD exports (if converted) allow non-designers to drag-and-drop elements, democratizing creation.
Ultimately, this template empowers you to communicate with confidence, turning data dumps into directed dialogues. Whether illustrating market shares or training benchmarks, it positions your insights front and center.
Frequently Asked Questions
What software do I need to edit this template?
It's fully compatible with Adobe Illustrator, InDesign, and Microsoft Word, with source files in .ait, .indt, and .dotx formats.
Can I use this for both print and digital brochures?
Yes, the design supports high-resolution printing and easy conversion to interactive PDFs for online sharing.
Are the graphs fully editable?
Absolutely - import your data directly, and adjust styles, labels, and animations as needed.
How many pages does the template include?
The core layout is a compact half-fold design, expandable to 8 pages with modular sections.
Is it suitable for educational materials?
Perfectly, with clear visuals ideal for student handouts or professional development guides.