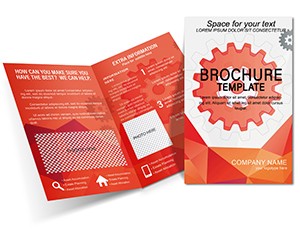
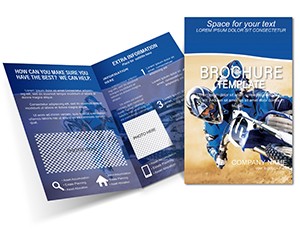
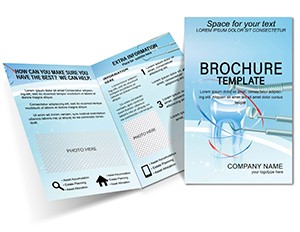
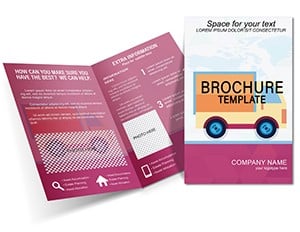
Graphical Price Analysis Brochure Template
Type: Brochures template
Category: Business
Sources Available: .ait, .dotx, .indt
Product ID: BT01501
Imagine distilling complex pricing data into a sleek, visual story that captivates your audience at first glance. Our Graphical Price Analysis Brochure Template does just that, transforming raw numbers into compelling narratives that highlight value, trends, and competitive edges. Designed for savvy marketers, financial analysts, and business leaders, this template packs essential information into a concise format that's easy to digest and impossible to ignore. Whether you're pitching a new pricing model to stakeholders or educating clients on cost breakdowns, this tool ensures your message lands with precision and polish.
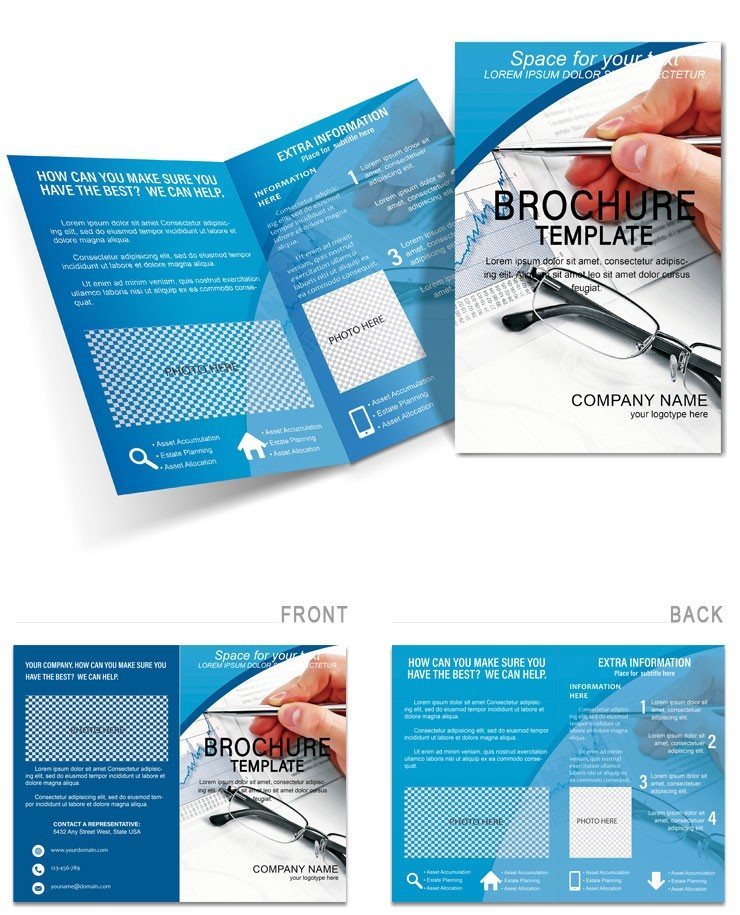
With its logical flow and consistent presentation, the template guides readers through key insights without overwhelming them. Picture a tri-fold layout where bold graphs on the front panel immediately draw eyes to market fluctuations, while inner spreads dive into detailed comparisons using clean icons and color-coded segments. It's not just a brochure - it's a strategic asset that positions your brand as data-driven and forward-thinking. And because it's fully editable in formats like .ait, .dotx, and .indt, you can tweak colors to match your corporate palette or swap in real-time data for that personalized touch.
Ready to turn pricing discussions into persuasive powerhouses? Grab this template today and watch how it simplifies your outreach while amplifying your impact.
Unlocking the Power of Visual Price Storytelling
At its core, this brochure template excels in breaking down price analyses into digestible visuals. Start with the cover: a striking bar chart overlay that teases your main takeaway, like seasonal pricing shifts or value propositions. As readers unfold it, they encounter layered infographics - think pie charts for market shares or line graphs tracing cost evolutions over quarters. Each element is vector-based, ensuring scalability for print or digital distribution without losing crispness.
What sets this apart from standard brochures? The intentional use of whitespace and hierarchy. High-contrast fonts guide the eye from headlines to supporting stats, making it ideal for busy executives scanning on the go. Plus, integrated callout boxes allow you to spotlight unique angles, such as discount tiers or ROI projections, without cluttering the design.
Core Features That Drive Results
- Multi-Format Compatibility: Seamlessly works in Adobe Illustrator (.ait), Microsoft Word (.dotx), and Adobe InDesign (.indt), so you can choose your preferred workflow.
- Editable Graphics: All charts and diagrams are fully customizable - resize, recolor, or replace data points with your own figures in minutes.
- Professional Layouts: Tri-fold structure with balanced panels for front, inside, and back, optimized for standard print sizes.
- Icon Library: Built-in symbols for currency, trends, and comparisons to add visual flair without extra design time.
- Color Schemes: Neutral bases with accent pops in blues and greens, evoking trust and growth - easily adaptable to your brand.
These features aren't bells and whistles; they're practical tools that save you hours in design revisions. A marketing coordinator at a mid-sized retailer, for instance, used a similar visual approach to refresh their annual pricing guide, resulting in clearer client communications that boosted inquiry rates.
Real-World Applications for Your Pricing Needs
This template shines in scenarios where clarity on costs can make or break a deal. For e-commerce teams, deploy it in supplier brochures to justify bulk pricing models, using stacked bar visuals to compare vendor quotes side-by-side. In consulting, leverage the inner timeline graphic to map out phased pricing for project bids, helping clients visualize long-term savings.
Real estate pros might adapt it for property valuation flyers, where bubble charts illustrate home price appreciations by neighborhood. The beauty lies in its versatility - swap the finance-focused icons for industry-specific ones, like gears for manufacturing cost analyses, and it fits like a glove.
Step-by-Step Guide to Implementation
- Gather Your Data: Compile key metrics, such as average prices, variances, and forecasts, into a simple spreadsheet.
- Open in Your Tool: Launch the file in Illustrator or InDesign; the layers are organized by panel for intuitive navigation.
- Input and Visualize: Paste data into charts via linked tables - watch as shapes auto-adjust for accuracy.
- Brand It Up: Apply your logo to the back panel and align fonts with your style guide.
- Proof and Print: Export as PDF for review, then send to print with bleed settings already configured.
Follow this workflow, and you'll have a polished brochure ready for distribution in under an hour. It's a far cry from starting from scratch in basic templates, where misalignment and guesswork eat up your day.
Why This Template Outshines Basic Options
Compared to generic brochure makers, this one prioritizes analytical depth. While free tools offer flat text blocks, our design embeds interactive-ready elements that pop in digital flips or hold strong on paper. It's built for professionals who know that a well-crafted visual can turn skepticism into sales - think of it as your silent salesperson, working 24/7.
Incorporate subtle animations if going digital, like fading in price trend lines, to engage webinar attendees. Or, for trade shows, the compact fold ensures it fits pockets while delivering heavyweight insights.
Don't let murky pricing docs dim your brand's shine. Customize this template now and craft brochures that not only inform but inspire action.
Frequently Asked Questions
What formats does the Graphical Price Analysis Brochure Template support?
It includes .ait for Illustrator, .dotx for Word, and .indt for InDesign, giving you flexibility across design platforms.
Is the template suitable for print or digital use?
Yes, it's optimized for both, with vector graphics that scale perfectly and export options for interactive PDFs.
Can I add my own data to the charts?
Absolutely - charts are linked to editable tables, so updating figures is straightforward and maintains design integrity.
How many panels does the brochure have?
The standard tri-fold design features six panels total: front, two inside left and right, back inside, and back cover.
Does it come with instructions for customization?
Layered files include notes on key elements, and a quick-start guide is embedded in the download package.