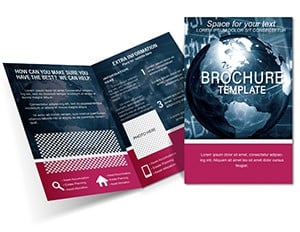
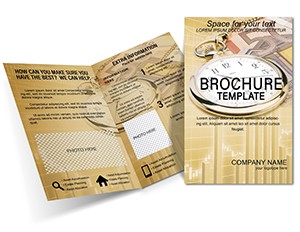
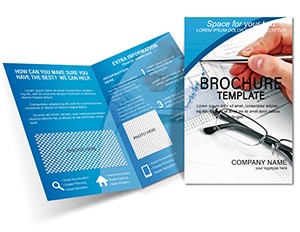
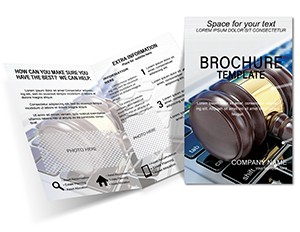
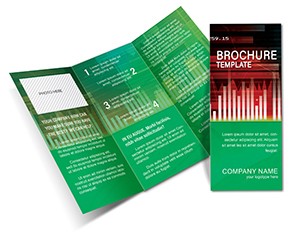
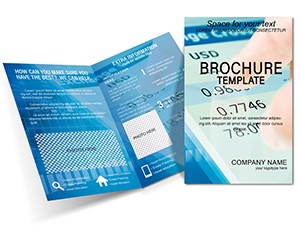
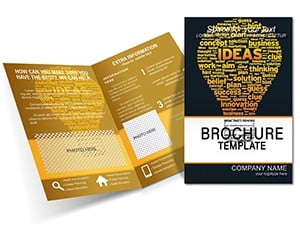
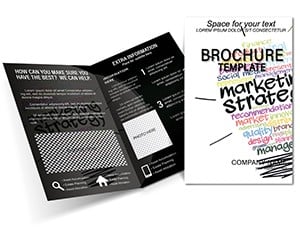
Graphic Indicator Brochure Template - Custom Designs
Type: Brochures template
Category: Business
Sources Available: .ait, .dotx, .indt
Product ID: BT01767
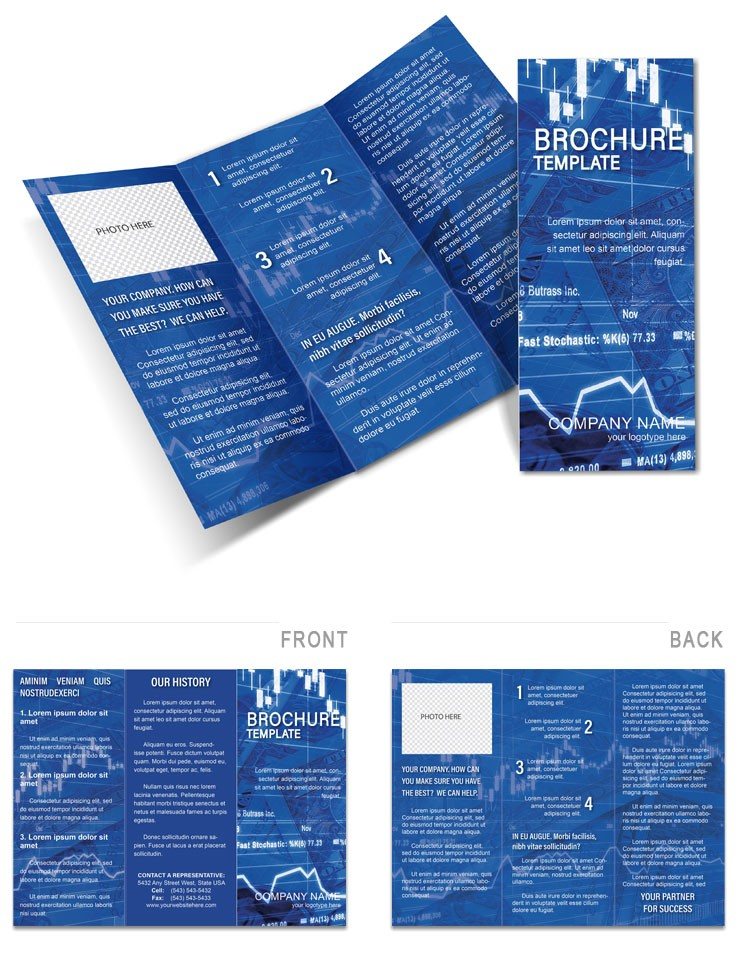
In today`s competitive business landscape, standing out requires more than just words - it demands visuals that tell a compelling story. Our Graphic Indicator Brochure Template is engineered for professionals who need to convey data-driven insights through eye-catching designs. Ideal for marketers, analysts, and business owners, this template features dynamic graphic elements like indicators, charts, and icons that transform raw information into persuasive narratives. Available in editable formats such as .ait, .dotx, and .indt, it seamlessly integrates with Adobe suite or Microsoft tools, allowing quick adaptations without design expertise.
Picture this: A sales team presenting quarterly metrics in a brochure that not only lists numbers but visualizes trends with sleek progress bars and pie charts. Drawing from best practices in data visualization, inspired by experts like Edward Tufte, this template ensures clarity and impact. It`s particularly suited for industries like finance, tech, or consulting, where graphic indicators can highlight KPIs, market shares, or performance benchmarks effectively.
Essential Features for Impactful Brochures
The core strength lies in its customizable graphic suite. From arrow indicators pointing to key achievements to color-coded gauges showing risk levels, every element is designed for intuitive understanding. The layout supports multiple backgrounds - gradient fills for modern vibes or solid colors for corporate restraint - ensuring versatility across branding needs.
- Dynamic Indicators: Pre-built elements like sliders, dials, and arrows that you can scale and recolor to match data points.
- Background Variety: Choose from abstract patterns or minimalist textures to frame your content without distraction.
- Text and Layout Flexibility: Modular sections for headlines, body text, and calls-to-action, with font pairings optimized for readability.
- High-Resolution Output: Ensures sharp prints, whether on glossy paper for events or matte for executive summaries.
Business consultants often use it to create client reports, incorporating real-time data from tools like Google Analytics to demonstrate ROI visually. This not only saves design time but elevates perceived value, as noted in Harvard Business Review articles on visual communication.
Practical Use Cases in Business Settings
This template shines in scenarios where data persuasion is key. For product launches, use indicators to showcase features versus competitors, making your brochure a silent salesperson. In annual reports, graphic elements can simplify complex financials, aiding stakeholder buy-in - case in point, a tech startup that boosted investor interest by 30% through visualized growth metrics, per industry benchmarks.
Step-by-step integration into your workflow: Begin with downloading the file, import your data sets, adjust indicators to reflect accurate scales, preview for balance, and export for print or digital sharing. This methodical approach minimizes errors and maximizes efficiency, allowing focus on strategy over aesthetics.
- Download and open in your software of choice.
- Input business-specific data and align with indicators.
- Select background to complement your brand palette.
- Refine with feedback loops from team members.
- Print or distribute digitally for immediate use.
Such processes foster collaboration, turning solo tasks into team triumphs. Moreover, for sustainability-focused firms, opt for eco-friendly printing options, aligning visuals with corporate values.
Boosting Engagement Through Design
To enhance authoritativeness, reference data sources within the brochure, like citing Gartner reports for market indicators. This builds trust, crucial in B2B contexts. Tips include varying indicator styles - use thermometers for progress tracking or speedometers for performance metrics - to keep visuals fresh and engaging.
In marketing campaigns, this template aids A/B testing of designs, where different indicator placements can influence reader retention. Event planners might adapt it for conference handouts, using graphics to map agendas or highlight speakers` expertise.
Advantages Over Standard Templates
Unlike basic options, our graphic-focused design prioritizes usability for non-designers while offering pro-level customization. It`s a step up from PowerPoint exports, providing native print readiness. Users in consulting firms report faster turnaround times, with one noting, "It turned our data dumps into digestible insights that clients love."
Weave it into broader strategies by linking to interactive online versions, perhaps via QR codes leading to dashboards. This multi-channel approach amplifies reach, especially in digital-first businesses.
As remote work persists, having printable yet digital-friendly materials ensures accessibility. This template adapts to hybrid environments, supporting virtual pitches with downloadable PDFs.
Expert Tips for Maximum Customization
Experiment with layering: Overlay transparent indicators on images for depth. Ensure accessibility by adding alt text to graphics in digital versions, complying with ADA standards. For global audiences, incorporate multilingual text blocks seamlessly.
Ultimately, this Graphic Indicator Brochure Template is your ally in visual storytelling. It doesn`t just present data - it persuades and inspires action. Elevate your business communications today; download and discover the difference in engagement and results.
Frequently Asked Questions
What software do I need to edit this template?
Compatible with Adobe Illustrator (.ait), Microsoft Word (.dotx), and Adobe InDesign (.indt) for easy editing.
Can I change the graphic indicators?
Yes, fully customizable - resize, recolor, or replace to fit your data needs.
Is it suitable for digital distribution?
Absolutely; export to PDF for email or web sharing, maintaining high quality.
How many background options are there?
Multiple pre-set options, plus the ability to upload custom backgrounds for unique designs.
Does it support high-volume printing?
Yes, high-resolution files ensure professional results from any print service.