How to Design a Business Recovery Program Presentation After Damage?
Learn how to structure a business recovery program presentation that turns damage assessment, funding needs, priorities, and timelines into a clear recovery case.
Design tips, tutorials, product updates, and industry insights.
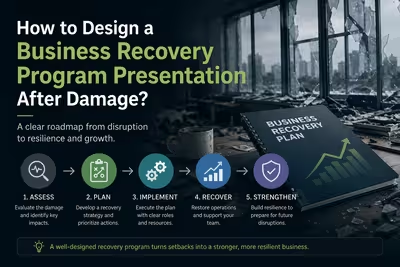
Learn how to structure a business recovery program presentation that turns damage assessment, funding needs, priorities, and timelines into a clear recovery case.
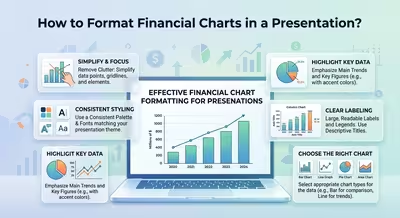
Learn how to format financial charts in a presentation so trends, variances, forecasts, and cash flow are clear, credible, and easy to read.
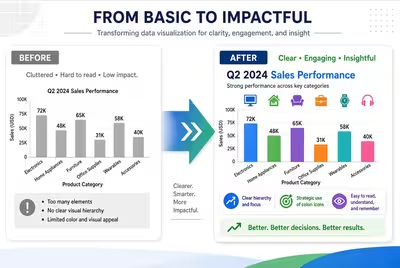
A strong before-and-after infographic does more than show two states. Learn how to structure the comparison so the change is instantly understood.

Pie charts can make a slide look polished while making the underlying comparison harder to understand. Here are the situations where another chart works better.

It's not the length that gets people hurt — it's what the length lets a deck quietly become.
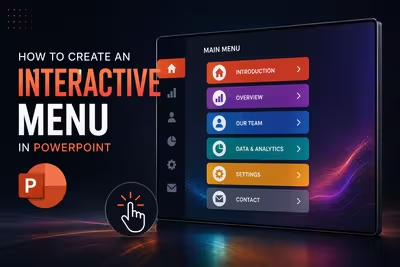
Learn how to create an interactive menu in PowerPoint using hyperlinks, buttons, and Zoom to build fast, flexible presentation navigation.

Learn how to use Slide Master in PowerPoint to build reliable layouts, control recurring elements, and fix presentation-wide formatting without fighting individual slides.

Moving a PowerPoint deck to Google Slides is easy; keeping its layout, fonts, charts, and animations intact takes a little more care.
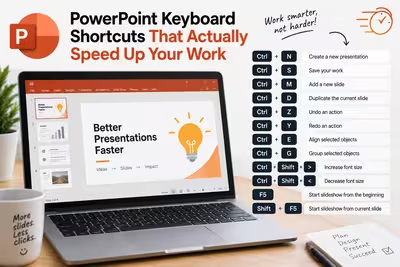
Most people know three PowerPoint shortcuts and assume that's the ceiling — here's what changes once you learn the other twelve.