Analytical Graphics Word Template: Precision in Financial Visualization
Type: Word templates template
Category: Finance - Accounting
Sources Available: .dotx, .jpg
Product ID: WT01490
In the meticulous world of finance and accounting, where every figure tells a story, the Analytical Graphics Word Template emerges as a vital ally for turning numbers into narratives. Tailored for analysts dissecting measurement results or concentration trends, it offers a sophisticated platform to showcase analyte data with elegance and exactitude. Ideal for quarterly audits, performance reviews, or investment appraisals, this template empowers you to deliver documents that not only meet standards but exceed expectations.
Finance pros often face the hurdle of dense spreadsheets; this template bridges that gap with graphical interfaces that make interpretations intuitive, fostering deeper stakeholder engagement.
Grounded in analytical rigor, it supports workflows from data ingestion to final polish, ensuring your graphics convey trends like revenue concentrations or risk distributions with unflinching accuracy.
Key Features Fueling Analytical Excellence
Crafted for depth, the template thrives in Word 2016+, available as .dotx for modifications and .jpg for references.
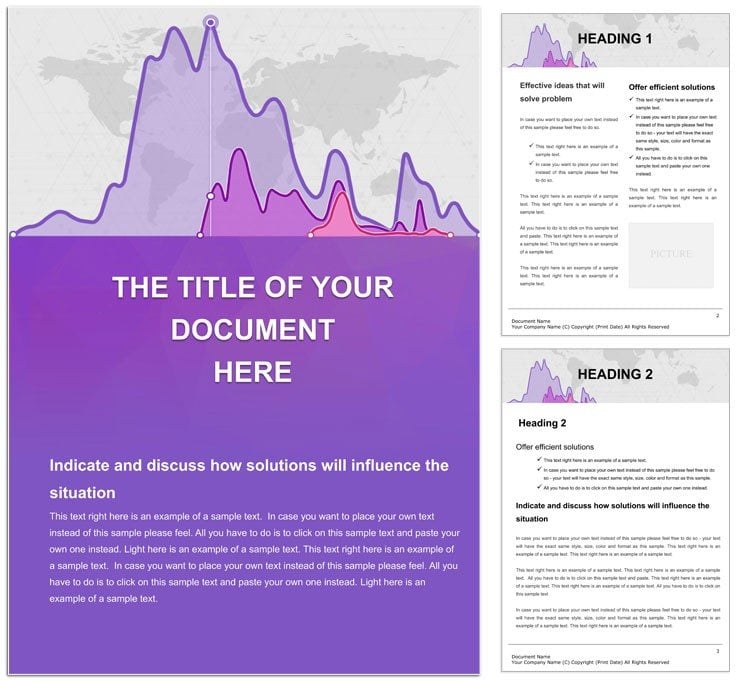
- Graphical Data Holders: Slots for bar graphs and pie charts depicting concentration analyses, with scalable vectors for high-res outputs.
- Measurement Tables: Formatted grids for logging results, including formula-friendly cells for calculations.
- Trend Line Sections: Linear and area plots ready for time-series data, auto-scaling for varying ranges.
Such tools streamline scrutiny. An accountant might use the variance report page to overlay actuals against budgets, leveraging the template's conditional formatting cues for instant insights.
Expert Tweaks for Deeper Analysis
Personalize via Word's Format Painter - copy styles across sections for uniformity. Insert dynamic elements like pivot table links from Excel, updating graphics on refresh.
A savvy adjustment: For forensic accounting, expand the anomaly detection layout with heat maps, coloring outliers to spotlight discrepancies in financial flows.
Targeted Use Cases in Accounting Arenas
This template fits seamlessly into finance routines, from tax preparations to forensic reviews. In budgeting cycles, its projection pages allow for scenario modeling, graphing best/worst cases to guide allocations.
For compliance checks, the audit trail sections provide chronological visuals of transaction concentrations, aiding in regulatory storytelling.
- Compile Metrics: Aggregate data from ledgers into template tables.
- Visualize Patterns: Drag data into graph placeholders for automated rendering.
- Validate Accuracy: Cross-check with built-in footnotes and sources.
- Distribute Securely: Password-protect before emailing or archiving.
This method not only accelerates reporting but aligns with practices seen in Big Four firms' analytical briefs.
Sharpening Financial Insights Through Design
The template's true value unfolds in its ability to illuminate patterns amid data deluges. Accounting docs can overwhelm; here, graphics distill essence, spurring informed dialogues. Integrate with Power BI exports for enriched visuals, elevating static pages to interactive realms.
It's the unsung hero for precision-driven pros, crafting outputs that withstand scrutiny.
Refine your analytical edge. Obtain the Analytical Graphics Word Template and graph your way to clarity.
Frequently Asked Questions
What types of graphics does this template support?
Primarily charts for measurements and concentrations, fully editable.
Can I link external data sources?
Yes, compatible with Excel embeds for live updates.
Is it geared toward accounting standards?
Designed with GAAP/IFRS-friendly layouts in mind.
What's the page count for comprehensive use?
Approximately 26 pages, from basics to advanced analytics.
How to handle color-blind accessibility?
Patterns and labels ensure inclusive visualizations.
Export options beyond Word?
Easy conversion to PDF with preserved graphics.