Economic Statistics Word Template: Illuminate Data with Clarity
Type: Word templates template
Category: Finance - Accounting
Sources Available: .dotx, .jpg
Product ID: WT01180
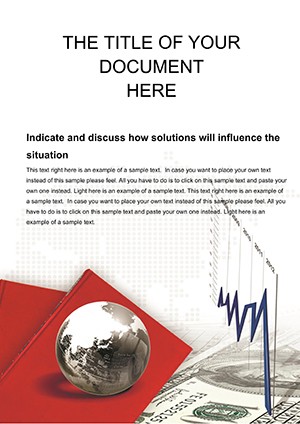
Delve into the pulse of a nation's economy, where interlocking sectors reveal stories of growth, interdependence, and human endeavor. The Economic Statistics Word Template serves as your analytical compass, providing a structured framework for dissecting macroeconomic landscapes. Geared toward economists, business students, and policy researchers, it transforms dense figures into digestible narratives that highlight potential and patterns.
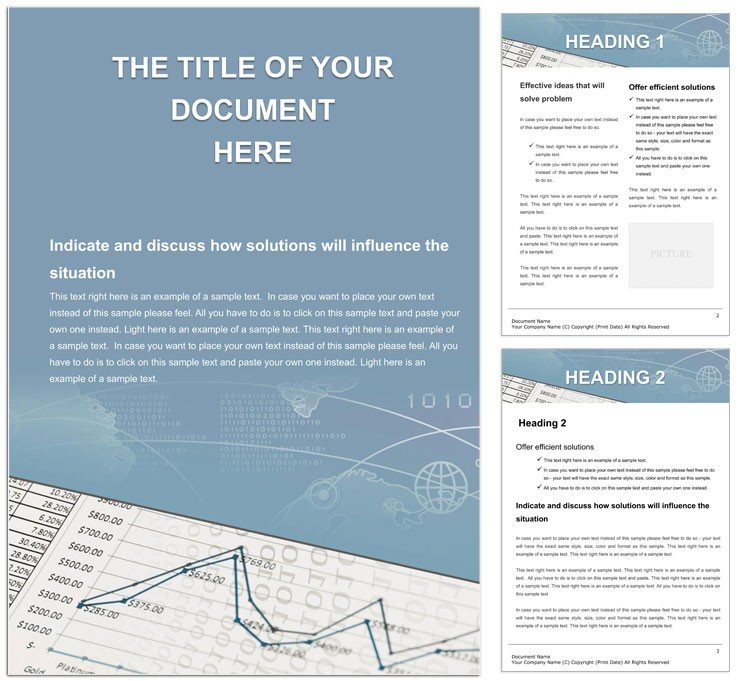
With a design rooted in precision - neutral grays for balance, accent blues for key metrics - the template facilitates breakdowns of industries, sectors, and systemic links. Perfect for annual overviews or thesis chapters, its grid-heavy layout supports formulas, graphs, and annotations without chaos. Move beyond scattered spreadsheets; here, your analysis sails coherently from macro views to micro details.
Engineered for Word 2016+, it includes formula-friendly tables and shape placeholders for visuals. An academic might model GDP flows, populating interconnected cells that mirror real economic webs, yielding reports as interconnected as the data they portray.
Robust Features for Analytical Depth
Central to its utility are elements honed for statistical rigor. Footers auto-populate references, while headers frame chapter titles with subtle economic symbols like gears.
- Analytical Color Coding: Subtle tones to differentiate sectors - greens for growth, reds for risks.
- Advanced Table Structures: Nested rows for hierarchies, with merge options for summaries.
- Editable Data Visuals: Vector charts and icons resizable for custom infographics.
It counters vague reports; a finance intern could aggregate sector stats, leveraging borders to delineate contributions clearly and compellingly.
Streamlined Start for Research Sessions
Activate the .dotx, then harness Insert > Table for expansions - the wizard suggests economic-friendly schemas. Styles ensure uniform formatting across lengthy analyses.
Strategic Use Cases: Mapping Economic Terrains
Students excel with it for capstone projects: Segment national subsystems in phased sections, graphing interdependencies with linked shapes. Policy wonks draft briefs, funneling activity results into executive abstracts.
Analysts in consulting apply it daily. Compiling a potential assessment? Step one: Catalog industries in the overview grid; step two: Link outputs via arrow flows; step three: Synthesize findings in a conclusion matrix. It trumps plain text by visualizing ties, turning numbers into narratives of societal momentum.
For broader applications, journalists could profile regional economies, embedding datasets amid explanatory paragraphs. The template's logic fosters holistic views, essential for understanding the economy's living fabric.
Blueprint for an Economic Sector Report
- Base Layer: Template init; outline scope in intro pane.
- Data Entry: Feed metrics into columnar sectors.
- Visualize Links: Connect with diagram tools for flow depiction.
- Analyze: Annotate trends in sidebar notes.
- Conclude: Summarize implications in footer synthesis.
This workflow distills complexity into clarity, empowering informed discourse.
Enhancement Strategies for Sharper Insights
Embed Excel links for real-time updates, or shade cells conditionally for threshold alerts. Sans-serif fonts keep it modern, echoing data dashboards. Such tweaks make your work as dynamic as the economies it explores.
Chart the course to deeper understanding - embrace the Economic Statistics Word Template today and let your analyses reflect the economy's true interconnected vitality.
Frequently Asked Questions
How does the template handle economic data tables?
It features pre-configured tables with formulas for sums and averages, expandable for complex datasets.
Are charts editable for custom statistics?
Vector-based charts allow data swaps and style changes directly in Word.
Can it support macroeconomic models?
Yes, interconnected sections and shapes facilitate modeling of sectors and flows.
Is it suitable for academic papers?
Ideal for theses, with reference footers and structured abstracts for scholarly formats.
Does it integrate with external data sources?
Link to Excel or CSV imports for seamless data population and updates.
What file formats come with it?
.dotx for templating and .jpg for previews, ensuring versatile use.