Chart Development Word Template: Visualize Economic Strategies with Impact
Type: Word templates template
Category: Finance - Accounting
Sources Available: .dot, .dotx, .jpg
Product ID: WT00960
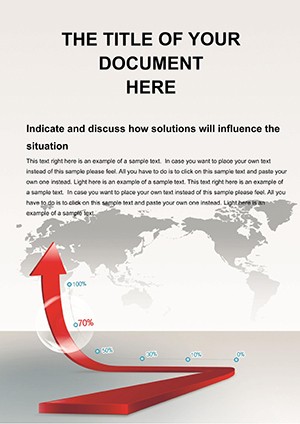
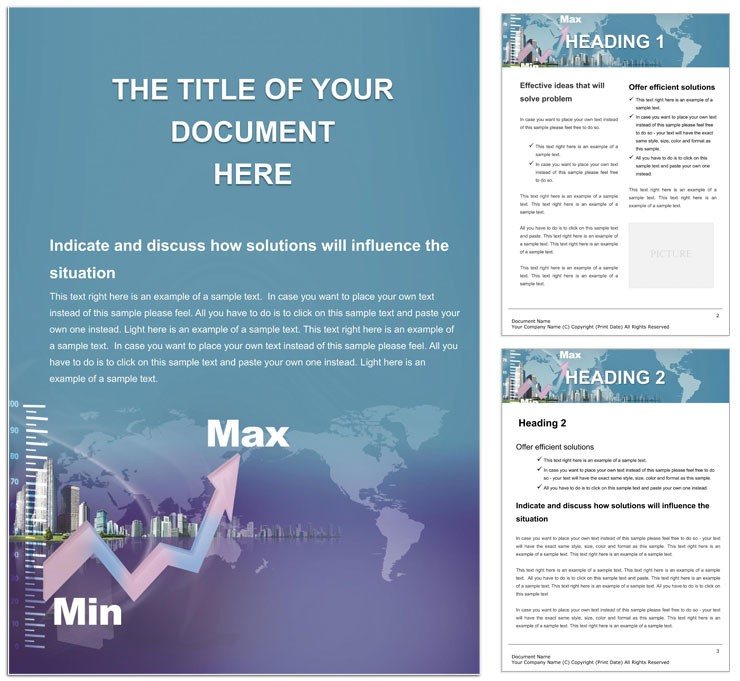
In the fast-paced world of business strategy, where numbers tell stories louder than words, having a document that turns raw data into a metropolis of insights can make all the difference. Our Chart Development Word Template is crafted for strategists, economists, and finance leads who craft reports on market trends, growth projections, or competitive analyses. Picture a background that subtly evokes a bustling city skyline intertwined with fluctuating chart lines - maximum peaks and minimum valleys rendered in sleek, professional hues - setting the stage for your narrative without overwhelming it.
This template isn't just a backdrop; it's a comprehensive toolkit with editable text, images, formatting, styles, and drawing objects that ensure your economic importance shines through. Compatible with Word 2010 and beyond, it supports everything from single-page briefs to multi-section whitepapers, helping users like portfolio managers or consulting firms present data-driven recommendations that stick. The urban motif adds a layer of modernity, reminding readers of the dynamic environments your strategies navigate.
Core Features That Drive Data Storytelling
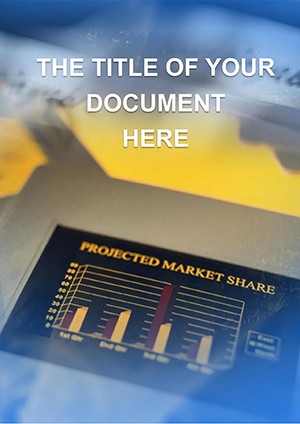
Dive into the template's robust features, starting with the high-fidelity chart placeholders that accept direct imports from Excel or manual sketches. These aren't static images; they're vector drawings that resize flawlessly, maintaining crisp lines whether you're zooming in on quarterly variances or panning out to annual overviews. The metropolis-themed background integrates seamlessly, using semi-transparent layers so your foreground content - be it bullet lists or infographics - remains the star.
- Dynamic Chart Integration: Pre-built axes and legends for line, bar, or pie varieties, with color-coded schemes that differentiate bullish from bearish trends at a glance.
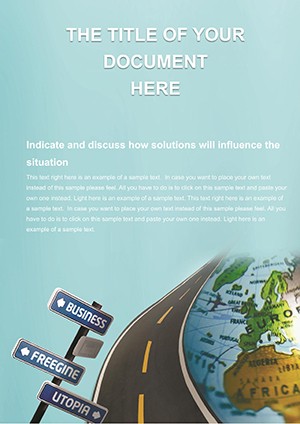
- Urban Visual Accents: Subtle skyline silhouettes and grid patterns that symbolize growth, editable to reflect specific locales like New York finance or Silicon Valley tech.
- Style Consistency Tools: Unified fonts (e.g., sans-serif for headers) and spacing rules that propagate changes across the entire document.
- Annotation Layers: Callout boxes and arrows for highlighting key data points, perfect for executive footnotes.
These tools empower a fluid creation process: Input your dataset, apply the template's auto-formatting, and iterate with ease. It's like having a design assistant embedded in Word, turning novices into polished presenters.
Practical Use Cases: From Strategy Sessions to Investor Pitches
Apply this template to real scenarios where visual punch amplifies your message. For a market analyst charting development trajectories, use the central spread to overlay economic indicators against urban expansion data - the template's grid alignment ensures perfect symmetry. A step-by-step workflow could unfold as:
- Import Base Data: Paste charts from analytics software; the placeholders snap them into place with matching scales.
- Layer Strategic Insights: Weave in explanatory paragraphs beside visuals, using the template's margin notes for deeper dives.
- Test Readability: Preview in print layout mode to confirm the background enhances rather than distracts.
- Distribute Confidently: Export to PDF with embedded fonts, preserving the metropolitan flair for virtual meetings.
Versus generic Word docs, this template elevates bland spreadsheets into narrative journeys, much as leading consultancies use themed visuals to contextualize global trends. It's especially potent for e-commerce strategists mapping supply chain efficiencies amid city-like logistical hubs.
Boosting Engagement in Collaborative Reviews
Team dynamics benefit too - share the file via cloud links, where co-authors can add annotations without altering core visuals. A strategy director might collaborate with a designer on color tweaks, resulting in a unified pitch deck alternative that's fully native to Word.
Sustained Value for Evolving Business Narratives
The template's adaptability ensures it serves across cycles, from initial forecasts to post-mortem reviews. Refresh the date stamps and swap datasets, and the structure holds firm, accommodating shifts like economic recoveries or sector pivots. Envision a finance VP leveraging it for annual economic outlooks, where the chart evolutions mirror real-world resilience.
Or in development planning, where it frames sustainability metrics against urban footprints, fostering discussions that lead to actionable policies. With its balance of aesthetics and utility, this tool becomes a staple, downloaded once for $22 but paying dividends in every report thereafter. Secure yours now and chart your path to compelling communications.
Frequently Asked Questions
What chart types does the template support?
It accommodates line, bar, pie, and scatter plots via editable vector placeholders.
Can the background be removed?
Yes, simply delete the header image layer - content adjusts automatically.
Is it suitable for academic reports?
Definitely, the professional styling works well for theses on economic modeling.
How many pages does it span?
The base is five pages, expandable indefinitely with section breaks.
Does it include Excel links?
Placeholders support OLE embeds for live data updates.
What's the file size?
Compact at under 2MB, optimizing for quick shares.