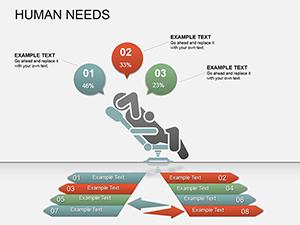
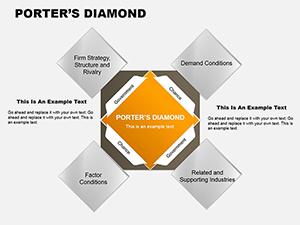
Navigate our PowerPoint workflow diagram templates, built to depict sequences, decisions, and handoffs with precision. These assets turn operational chaos into coherent maps, ideal for process documentation and training.
Geared toward operations managers, IT specialists, and coordinators, they provide robust frameworks for dissecting and displaying routines. Customize paths, nodes, and annotations to reflect real-world dynamics.
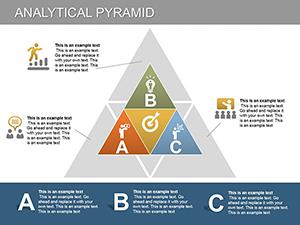
Within this workflow-focused category, find linear, branched, and parallel designs attuned to PowerPoint`s capabilities. Enhance collaboration and efficiency - explore and implement today.

Edge over standards: Conditional branching with toggle switches, simulating decision points interactively. Avoids the linearity trap of basic flows.
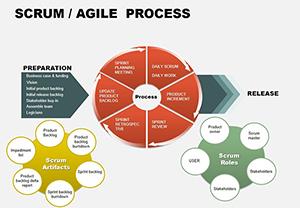
HR uses approval workflows for onboarding. Dev teams chart CI/CD pipelines. Logistics firms diagram supply chains.
Productivity gain: Clarifies roles, reducing errors by 40%.
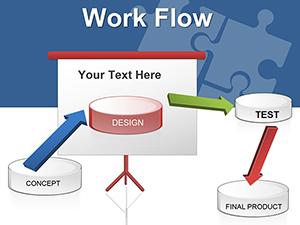
Start with endpoints: Inputs to outputs frame the journey. Use swimlanes for cross-functional views. Animate delays to underscore timelines.
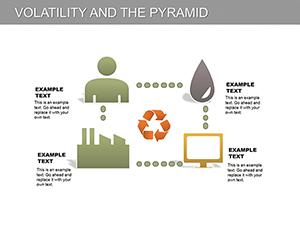
Innovate: QR codes on diagrams link to SOPs. Color-code by department for instant recognition.
Map mastery - secure a template now.
Ops lead`s BPMN diagram standardized procedures, slashing training time. Startup`s user journey map refined UX, hiking retention.
Integrates with Visio exports for depth.
| Variant | Scenario | Benefit |
|---|---|---|
| Linear | Simple Tasks | Quick Scans |
| Branched | Choices | Scenario Coverage |
| Parallel | Concurrent | Resource Allocation |
Comprehensive coverage for complexities.
Flow forward - download diagrams.
Iterate with feedback loops in designs. Use metrics overlays for performance tracking. These elevate from maps to actionable blueprints.
Team sync via comments; track changes historically.
PowerPoint workflow diagrams drive efficiency. Activate yours.
Copyright © 2009-2026 ImagineLayout All rights reserved.