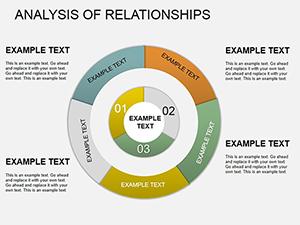
Visually oriented PowerPoint diagram templates bring your concepts to life with striking aesthetics and intuitive structures. Tailored for visual thinkers in design, leadership, and consulting, they excel at turning tangled thoughts into organized masterpieces.
Featuring vibrant icons, gradient fills, and responsive layouts, our selection ensures diagrams that captivate from the first slide. Benefits abound: heightened retention through eye-catching designs, easy integration of multimedia, and compatibility with PowerPoint`s robust features.
These appeal to creators who want presentations that feel artistic yet professional. Think of a strategy session where interconnected nodes reveal synergies, or a pitch where timelines pulse with energy.
By emphasizing visual hierarchy, they guide eyes naturally, amplifying your points. Optimized for high-DPI displays, they maintain sharpness in boardrooms or webinars.
Discover the visually tagged PowerPoint diagrams and infuse your slides with creativity.

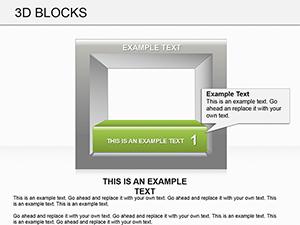
Standard diagrams fade into monotony; our visually tagged ones infuse personality with hand-drawn elements and subtle shadows. They support 4K exports, ideal for large screens, and include hover effects for digital interactivity.
Designers use them for mood boards; leaders for org charts that inspire teams. Consultants craft value chain visuals that uncover opportunities at a glance.
Superior to plain vectors, these boast embedded animations that unfold like stories. Pro tip: Balance saturation - vibrant accents on neutral backgrounds draw focus without overwhelming.
Anchor diagrams in your core message; use scale to emphasize importance. Our templates provide grid snaps for precision, ensuring alignment across slides.
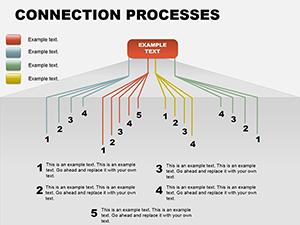
Accessibility via alt descriptions and scalable fonts broadens appeal. A creative director shared how our ecosystem diagram visualized brand ecosystems, winning a key account with its immersive flow.
Similarly, a workshop facilitator employed network diagrams to map collaborations, enhancing group dynamics. Incorporate negative space for breathing room, letting visuals breathe.
For motion, sequence reveals to mimic thought processes. Select a visual diagram now and watch engagement soar.
Visuals are the language of ideas. Explore these diagrams and paint your presentations vividly.
Copyright © 2009-2026 ImagineLayout All rights reserved.