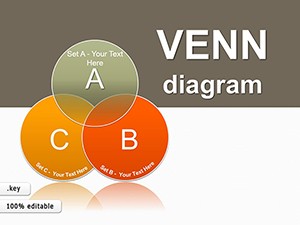
Simplify complex ideas in Keynote with our visual diagram templates, rich in icons, arrows, and hierarchical structures. For strategists, trainers, and analysts, they make abstract notions tangible through engaging visuals.
Enjoy streamlined editing with drag-and-drop components and color-coded categories, turning dense info into digestible graphics. Boost comprehension and retention in every presentation.
Examine our illustrative assortment and select diagrams that illuminate. Visualize success starting now.


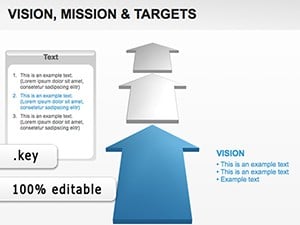
These templates employ mind maps and process flows to unpack strategies, far surpassing text walls. Consultants diagram client journeys; educators break down theories.
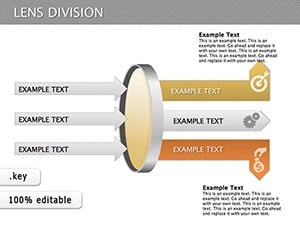
The icon libraries evoke universality, aiding cross-cultural talks. Scalable vectors maintain clarity at any zoom.
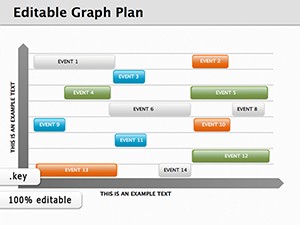
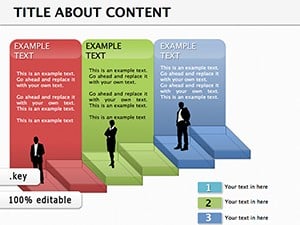
HR outlines org structures; project managers flowchart timelines. Creatives storyboard concepts visually.
Advanced over defaults, ours feature gradient nodes and shadow depths for 3D-like appeal.
Fuse with photos for hybrid diagrams or interactive hotspots for drills-downs.
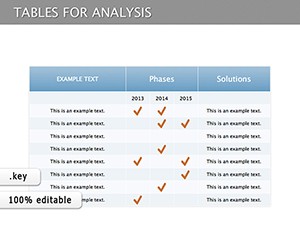
Visual diagrams accelerate decision-making, like SWOT analyses in boardrooms. They integrate with tables for data-backed narratives.
Acquire a template and diagram dynamically. Perfect for visual learners.
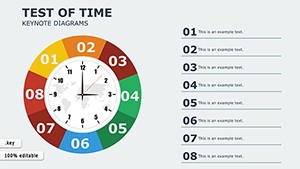
A team streamlined workflows via a custom process map, cutting errors; a seminar used radial diagrams for topic branching.
Accessibility via alt descriptions included.
Illuminate your Keynote with these visual diagrams. Download for clearer communications.
Copyright © 2009-2026 ImagineLayout All rights reserved.