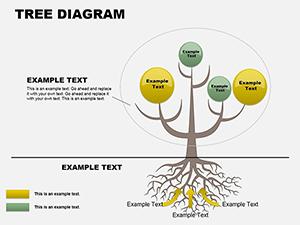
Organize thoughts and structures effortlessly using our tree diagram PowerPoint templates, suited for project leads, educators, and strategists. These versatile designs depict branching relationships, from family lineages to corporate org charts, in crisp, scalable formats.
Compatible with Microsoft PowerPoint, they offer radial, vertical, and horizontal layouts with customizable nodes, colors, and connectors. Perfect for brainstorming sessions or annual reports, they clarify complexities at a glance.
For users navigating information overload, these templates provide intuitive tools to expand or collapse branches, fostering dynamic discussions. Whether mapping product roadmaps or evolutionary timelines, achieve precision with minimal effort.
Branch out boldly - discover our selection and diagram your vision today.
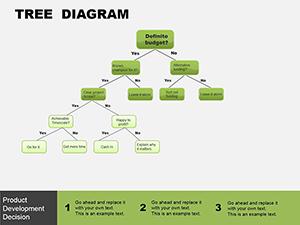
HR professionals illustrate reporting lines with org tree templates, highlighting roles and spans of control for onboarding clarity. Product managers chart feature dependencies, using decision branches to weigh pros and cons visually.
Educators teach phylogenetics with biological tree structures, annotating evolutions with icons. Standard diagrams often lack flexibility; ours include zoomable layers for detailed sub-branches without crowding.
Consultants model risk assessments, branching scenarios from threats to mitigations. Non-profits outline program impacts, tracing funds from donors to beneficiaries.
Writers plot novel outlines, with character arcs as narrative trees. Linguists diagram syntax, connecting words hierarchically for grammar lessons.
Superior to built-in SmartArt, our templates use vector graphics for infinite resizing and theme harmony. Auto-alignment ensures balanced trees, even with uneven branches. They`re accessible with ARIA labels for screen readers.
Best practices: Limit levels to four for digestibility; color-code by category for quick scans. Implementations show 25% faster comprehension in meetings. Add hyperlinks to nodes for interactive explorations.
A tech firm restructured via our org template, smoothing transitions with visual previews. Technique: Animate growth from root to leaves, symbolizing expansion.
Environmental group mapped biodiversity, engaging stakeholders on conservation paths. Rotate layouts for portrait presentations; cluster related branches with dashed lines for emphasis.
Grow your ideas structurally - select a tree diagram template and connect the dots.
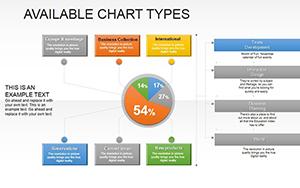
From binary decision to multi-level org charts, covering linear and radial varieties.
Exportable to PPTX for Slides compatibility, retaining most features.
Use duplicate node shortcuts and auto-connectors for seamless expansions.
Yes, photo placeholders fit avatars or icons within branches.
Up to 10, with collapsible options to manage depth on slides.
Absolutely, mirrored connectors for Arabic or Hebrew structures.
Copyright © 2009-2026 ImagineLayout All rights reserved.