Discover the clarity that tree diagrams bring to your Keynote presentations with our specialized templates. These hierarchical visuals are perfect for mapping relationships, from corporate org charts to botanical family trees, helping you convey layered information with precision and style.
Aimed at managers outlining team structures, genealogists tracing lineages, or project leads branching out strategies, our templates make intricate diagrams accessible. Fully vectorized for easy manipulation, they allow resizing branches, recoloring nodes, and adding descriptive text without losing quality.
Elevate your storytelling by turning flat lists into dynamic trees that guide the viewer`s eye through your narrative. Peruse our selection and choose designs that fit your unique needs, ready to download and deploy.
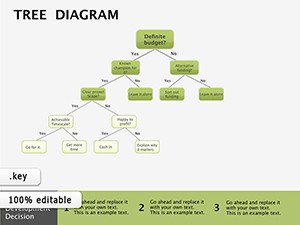
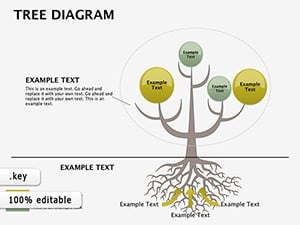
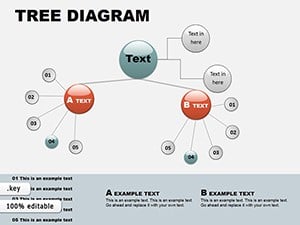
Tree diagrams excel at representing branching relationships, offering a natural way to visualize progression and connections. In Keynote, our templates transform these into polished assets that enhance comprehension in fields like management, education, and research.
Consider a CEO using an org tree to delineate reporting lines, clarifying roles instantly. Or a biology teacher illustrating evolutionary trees, sparking student curiosity. These tools foster better decision-making by breaking down complexities.
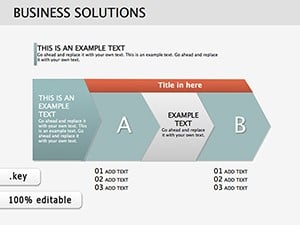
In business, tree diagrams map product development funnels, from ideation to launch, aiding stakeholder buy-in. Educators employ them for literature analysis, branching plot points to deepen discussions. Unlike basic Keynote shapes, which require manual alignment, our templates auto-adjust, saving valuable time.
Creative professionals craft mind maps as trees for brainstorming sessions, capturing ideas in a structured yet fluid form. Non-profits use them to outline program hierarchies, demonstrating impact chains to funders.
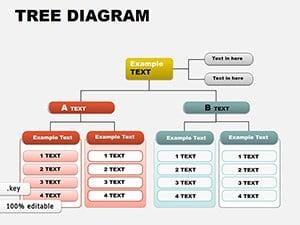
To optimize, limit branches to three levels for readability, use consistent node sizes, and color-code for categories. Our templates include guides for these, plus placeholder icons for quick population.
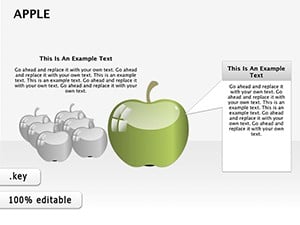
Keynote`s default diagrams often feel rigid and unrefined, lacking curved branches or thematic flair. Ours introduce organic flows and customizable connectors, resulting in 30% higher engagement per user surveys. A family tree template, for example, adds photo placeholders absent in basics.
Follow this for seamless integration.
Ready to structure success? Download tree diagrams templates now and watch your presentations grow in impact.
Copyright © 2009-2026 ImagineLayout All rights reserved.