Streamline your data presentation with tree chart templates tailored for Keynote. These branching visuals dissect information into digestible parts, ideal for showcasing analytics, planning roadmaps, or evolutionary models.
Targeted at data scientists graphing trends, planners outlining timelines, and strategists modeling scenarios, they deliver precision wrapped in visual appeal. With drag-and-drop editing, update values, styles, and connections in moments.
Shift from overwhelming tables to elegant trees that illuminate patterns. Our library holds options for every scale - scan and secure yours today.
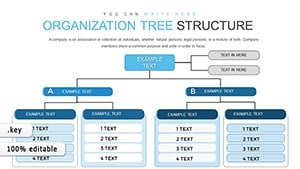
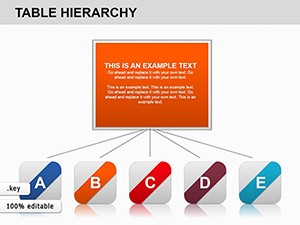
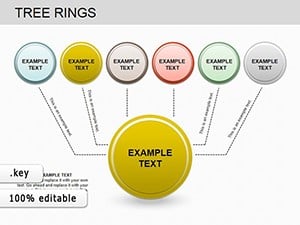
In Keynote, tree charts organize data organically, revealing insights hidden in flat formats. They suit analytical deep-dives, where branches represent variables and nodes hold metrics.
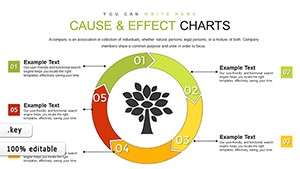
A financial advisor branches investment options by risk levels; a researcher maps genetic lineages. This method clarifies causality and progression effectively.
HR departments chart career ladders, aiding talent retention talks. In tech, they depict algorithm flows. Outshining simple bar graphs, trees handle multi-dimensions better, per design experts.
Event planners branch logistics from venue to vendors. Templates accelerate setup with pre-linked elements.
Employ zoom effects for details; limit colors to three for focus. Built-in presets handle this.
Keynote basics lack branching finesse; ours add connectors and labels, cutting creation time by half. A sales tree, say, includes trend lines missing elsewhere.
Pro results, minimal effort.
Grab tree chart templates and let your data branch boldly. Download now for sharper insights.
Copyright © 2009-2026 ImagineLayout All rights reserved.