Clarify complex transport dynamics using our specialized PowerPoint diagram templates. Aimed at analysts, engineers, and coordinators, these include flowcharts for supply pipelines, Sankey visuals for energy in vehicles, and network graphs for interconnected hubs.
Each diagram leverages PowerPoint`s SmartArt enhancements, with connectors that auto-adjust and color gradients denoting efficiency levels. Perfect for dissecting bottlenecks or forecasting expansions, they integrate seamlessly with data imports from Excel.
For rail, road, or air sectors, these tools distill vast info into digestible visuals. Animate paths to simulate real-time movements, captivating technical audiences.
Map your strategies - select a diagram and build clarity.
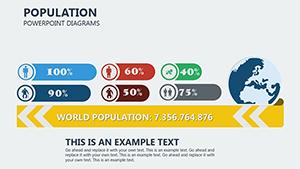
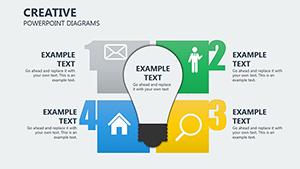
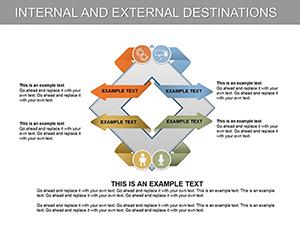
Diagrams transform abstract transport data into actionable insights. In business, model cost distributions across modes with radial charts. Creatively, artists render conceptual designs, layering abstract lines for futuristic networks.
Trainers use them for simulations, stepping through failure points in logistics chains. They outshine static images with interactivity - hover effects revealing metrics - far beyond plain drawings.
Break down assembly lines for new hires with sequential arrows.
Basic shapes lack the scalability of our vector diagrams, which resize flawlessly. Thematic nodes - like truck icons for road segments - add context, with legends auto-generating. Optimize by aligning to gridlines and using consistent line weights for professionalism.
Export as SVGs for web embeds, preserving editability.
These elevate comprehension.
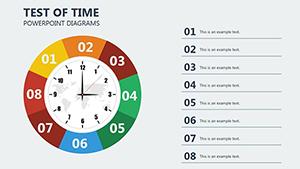
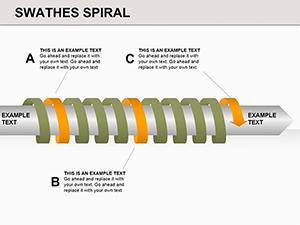
A logistics Sankey: Widths proportional to volumes, branching from suppliers to retailers. Or a Gantt variant for project timelines, bars styled as rail tracks with milestone signals.
For innovation, fuse with 3D rotations in newer PowerPoint versions.
Pair with presenter notes detailing assumptions, encouraging Q&A. Update dynamically via linked data sources for live sessions.
Diagram your success - grab a template now.
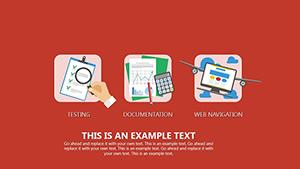
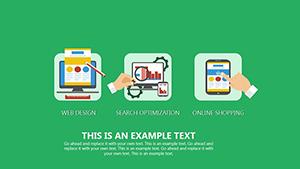
Flowcharts, org charts, timelines, and process maps.
Yes, paste linked tables for auto-updates.
Draw or import via Insert > Shapes.
Full support for paths and fades.
PDF, PNG, or editable PPTX.
Illuminate your transport visuals - start diagramming.
Copyright © 2009-2026 ImagineLayout All rights reserved.