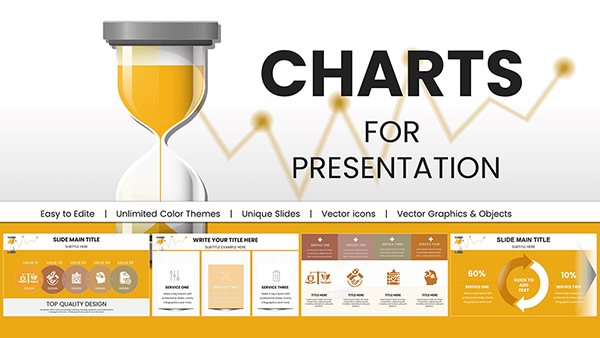
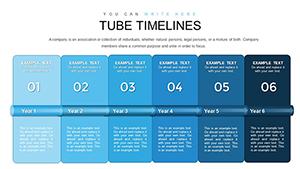
Bring order to chaos with our timeline PowerPoint charts, where data dances along time`s axis in captivating ways. Combining bars, lines, and milestones, these charts are tailored for analysts, strategists, and team leads presenting evolutions and forecasts.
Experience the edge: interactive elements that respond to clicks, revealing sub-details, and themes that adapt to branding. They turn spreadsheets into stories, highlighting peaks and pivots effortlessly. Scalable for any slide count, they fit TED talks or executive briefs.
From sales funnels to R&D pipelines, select a chart that mirrors your trajectory. Our designs prioritize intuition, making complex timelines digestible. Ignite your next presentation - explore and download.


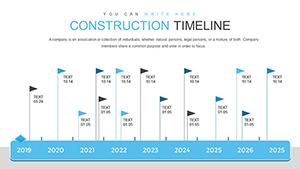
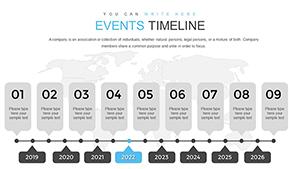
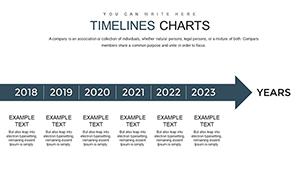


Timelines in chart form add precision to presentations, and ours in PowerPoint amplify that with layered data views. Unlike static images, these charts link to Excel for live updates, ensuring accuracy. Sales teams chart quarterly growth, with trend lines forecasting Q4 surges.
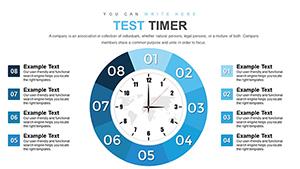
Engineers map testing phases, color-coding pass/fail rates. The animation sequences build reveal by reveal, pacing your delivery perfectly.
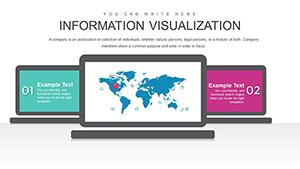
Consultants use them for client roadmaps, embedding KPIs at intervals. Event coordinators timeline logistics, with Gantt bars for vendor syncs. Basic PowerPoint charts lack timeline specificity; ours integrate natively for speed.
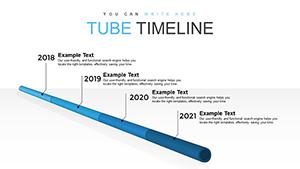
Expert advice: Anchor axes clearly, use gridlines sparingly, and legend placements for quick reads. Pair with speaker notes for deeper context.
"Growth Arc" chart propelled a startup`s demo, animating revenue climbs to seal funding. In healthcare, "Treatment Path" sequenced patient journeys, improving compliance visuals.
These illustrate charts as persuasive tools, molding data to messages.
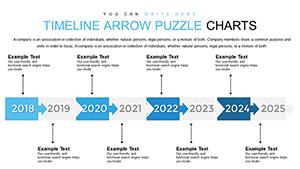
Utilize VBA for interactivity if needed, or morph transitions for fluid shifts. Accessibility via alt text and high contrast ensures inclusivity. Backup with data sources slides for transparency.
Plot precisely - choose your PowerPoint chart timeline.
Advance along the axis - download your timeline chart now.
Copyright © 2009-2026 ImagineLayout All rights reserved.