Winning tenders requires clarity and professionalism. Our collection of over 100 tender process diagram templates helps you present bid stages evaluation criteria and compliance requirements with confidence.
These clean modern designs feature full editability subtle animations and layouts optimized for formal presentations.
Whether submitting government contracts construction bids or corporate RFPs these diagrams make complex procurement processes easy to follow.
Impress evaluation panels with visuals that demonstrate thorough understanding and organization.

Tender documents and presentations are judged on both content and presentation. Professional diagrams show attention to detail and help evaluators quickly understand your approach.
Our templates are designed specifically for procurement professionals consultants and bidding teams.
Navigate strict compliance requirements with structured visuals.
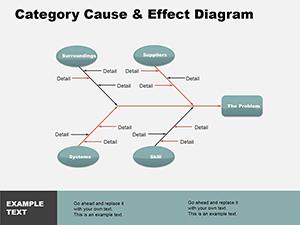
Illustrate project phases risk management and resource allocation.
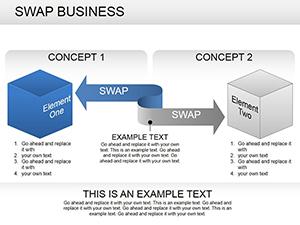
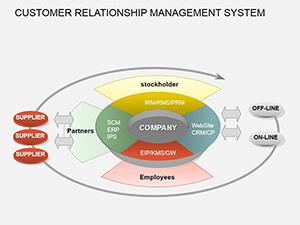
Present vendor selection processes and contract frameworks internally.
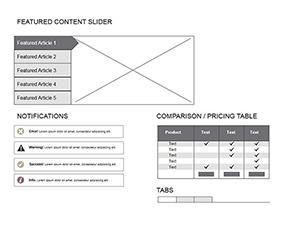
Generic diagrams often miss procurement-specific elements. Our templates include:
Give your bid the visual edge it deserves. Explore our tender process diagrams and download today.
Yes - we include diagrams for open restricted negotiated and framework tenders.
Every template is fully editable so you can apply logos colors and fonts easily.
Yes several professional designs are free with premium options offering more detailed layouts.
Yes multiple weighted scoring matrices and comparison tables are included.
Absolutely - clean minimalist styles meet official presentation standards.
Copyright © 2009-2026 ImagineLayout All rights reserved.