Harness the power of visual thinking with our technology-themed Keynote diagram templates. Tailored for the digital age, these designs facilitate everything from algorithm breakdowns to network architectures, appealing to software engineers, IT consultants, and product managers who demand precision and style in their Apple workflows.
Featuring circuit-like motifs and binary-inspired layouts, the templates make abstract concepts tangible - think flowcharts for app development cycles or Venn diagrams for feature overlaps. Fully vector-based, they scale flawlessly, ensuring clarity during virtual demos or in-person tech talks.
Empower your ideas with tools built for innovation. Discover our collection of tech Keynote diagrams and integrate them into your next project seamlessly.

In the realm of technology, diagrams bridge the gap between code and comprehension. Developers use UML sequence diagrams to outline API interactions, clarifying team collaborations. UX designers employ wireframe diagrams to prototype user journeys, accelerating feedback loops in agile sprints.
Cybersecurity experts visualize threat models with layered defense diagrams, enhancing risk assessments. For startups, SWOT analysis diagrams in tech style pinpoint market opportunities. These applications underscore diagrams` role in fostering innovation across coding, design, and strategy.
Basic Keynote shapes pale against our tech-optimized templates, which embed smart connectors and auto-align features for effortless revisions. Conventional tools demand manual tweaks, often leading to misaligned nodes; ours maintain structural integrity with drag-and-drop simplicity.
Incorporating futuristic elements like holographic effects or code snippet placeholders, they resonate with tech audiences more than sterile defaults. Editable layers allow for iterative prototyping, saving development time while preserving a polished, forward-thinking aesthetic.
Prioritize modularity: design diagrams as reusable components for consistent documentation. Use color coding - blues for inputs, reds for alerts - to denote functions intuitively. Animate paths to simulate processes, like data traversal in algorithms, for dynamic explanations.
Ensure accessibility with alt text for exported images and high-contrast modes. Collaborate via Keynote`s sharing, iterating in real-time. These strategies amplify diagrams` utility in tech ecosystems, from hackathons to executive briefings.
Unlock potential - select a tech diagram template and architect your visions with precision.
Yes, with placeholders for syntax highlighting and flowchart elements.
Export as PDF, PNG, or SVG for integration into reports or code docs.
Extensive library of vector icons like servers, clouds, and circuits.
Fully adjustable with auto-snapping for professional alignments.
Custom builds mimic digital pulses and data streams.
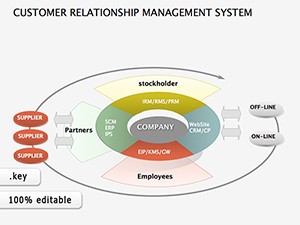
Beyond basics, fuse diagrams with Keynote`s charts for hybrid tech visuals, like ERDs with metrics for database pitches. This 1,300-word exploration reveals endless possibilities. Embrace tech diagrams to code the future of your presentations.
Copyright © 2009-2026 ImagineLayout All rights reserved.