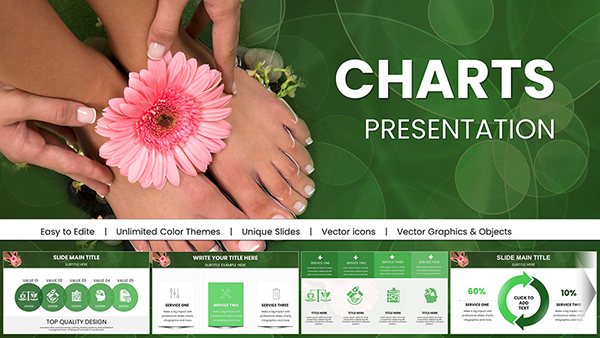
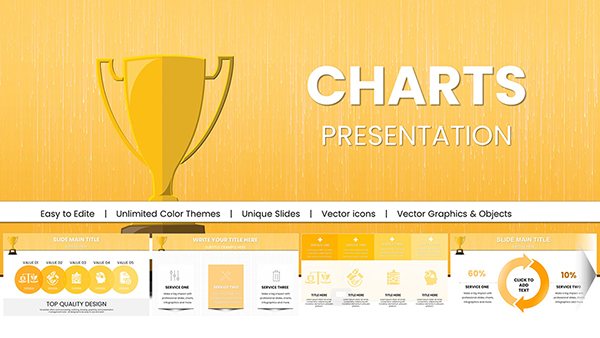
Simplify sequential data with our strip chart Keynote templates, perfect for illustrating workflows, timelines, and progressions in a linear, easy-to-follow format. These layouts transform disjointed information into cohesive narratives, ideal for project managers, historians, and process engineers seeking clarity in presentations.
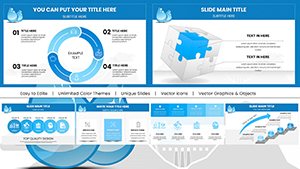
Each template employs horizontal or vertical strips that build progressively, supporting milestones, stages, or metrics with customizable connectors and icons. Keynote`s precision tools make adjustments precise, ensuring professional results with minimal effort.
Unravel intricacies visually - explore the range and streamline your storytelling today.


Strip charts excel at depicting order and evolution, and our templates amplify this by providing modular bands that layer information hierarchically. Whether tracking project phases or historical events, they guide audiences through journeys logically, reducing cognitive load.
Compatible with Keynote`s shape library, they allow infinite segmentation, from micro-tasks to macro-campaigns, fostering comprehension in diverse settings.
Product developers map R&D pipelines, with strips denoting prototype iterations. Event planners outline agendas, timing sessions visually. Educators chronicle literary arcs, embedding quotes along narrative bands.
These implementations underscore the templates` utility in ordered expositions.
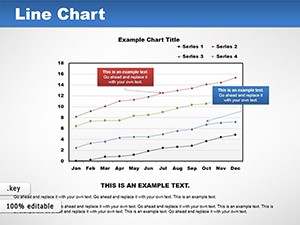
Bar or line charts scatter focus; strip designs maintain directional flow, akin to storyboards. Our versions include gradient fills for emphasis and snap-to-grid alignment for perfection, features basic charts overlook.
They scale effortlessly for long sequences, wrapping or extending without distortion, unlike cramped alternatives.
Define strip widths proportionally to importance, using rulers for accuracy. Color-code categories consistently, drawing from brand guidelines. Animate builds to reveal strips sequentially, mimicking unfolding stories.
Integrate callouts for annotations, popping details on hover. Export segments as standalone graphics for reports.
A logistics firm streamlined supply chain audits with our template, identifying bottlenecks visually. Authors illustrated plot developments, aiding pitch decks. Fitness coaches tracked client journeys, motivating with milestone strips.
Extend with interactive hotspots linking to sub-processes. Or, vertical strips for mobile-optimized vertical scrolls in hybrid formats.
Innovation lies in adapting strips for non-linear paths, like decision trees with branching connectors.
35+ templates, with icon sets and color swatches. Sequence your success - download and design now.
Strips emphasize layered, parallel sequences, while timelines focus on singular chronological lines.
Yes, using Keynote`s curve tools for organic flows like river diagrams.
Prepped with build paths for smooth, directional reveals.
Hyperlink strips to videos or forms, enhancing engagement.
Export to PowerPoint or PDF, preserving structure.
Copyright © 2009-2026 ImagineLayout All rights reserved.