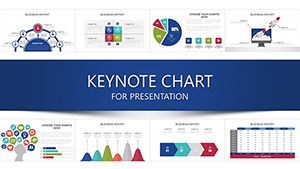
Visualize your strategies with precision using our Keynote charts templates, tailored for analysts, educators, and presenters who demand clarity in every graph. These designs turn raw data into compelling narratives, perfect for annual reports or team briefings.
From pie charts highlighting market shares to line graphs tracking progress, our templates offer variety and ease. Built-in animations reveal insights progressively, keeping audiences engaged without overwhelming them.
Compatible with Apple Keynote, they`re ideal for Mac users seeking seamless integration. Whether simplifying complex datasets or emphasizing trends, these tools make your message unforgettable. Browse now and chart your path to success.
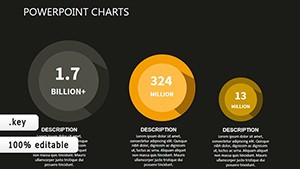
Keynote charts templates adapt to numerous contexts, like financial analysts plotting quarterly earnings with bar variants that compare year-over-year growth. In education, teachers illustrate lesson outcomes via scatter plots, fostering interactive discussions.
Marketing pros deploy funnel charts to depict conversion paths, guiding strategy tweaks. Even event planners use Gantt-style timelines for logistics overviews.
This flexibility ensures relevance across fields.
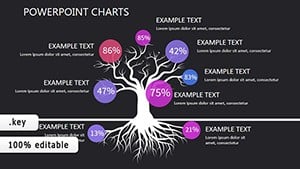
Keynote`s defaults suffice for basics but lack polish for professional use, often resulting in pixelated edges or rigid scales. Our templates provide vector-based graphics for crisp scaling and customizable axes for nuanced data.
Side-by-side: A default chart might obscure trends in dense clusters, while ours uses gradient fills and legends for instant clarity, improving decision-making speed.
Pre-configured for accessibility with alt text prompts and color-blind friendly palettes. Best practices: Choose chart types matching data nature - avoid pies for more than 7 segments. Animate entrances to build suspense.
Innovate by embedding live data links from Numbers for auto-updates.
Select templates based on story angle - radial for cycles, area for accumulations. Layer transparency for overlays, and align with slide themes for cohesion. Review for accuracy post-edits.
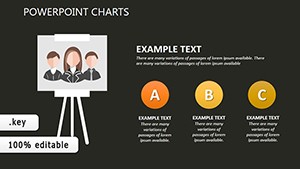
Insight: Combine charts with icons for thematic depth, like upward arrows on growth lines.
Elevate your visuals? Download and experiment with these charts today.
A biotech firm showcased trial results with our multi-series templates, accelerating investor interest. Consultants visualized client KPIs in dashboards, earning praise for intuitive designs.
Creative application: Artists repurpose for portfolio metrics, graphing inspiration sources dynamically.
Pair with full Keynote templates for complete decks. Explore our collection now.
Copyright © 2009-2026 ImagineLayout All rights reserved.