Illuminate your business strategies with sophisticated Keynote chart templates, geared toward decision-makers, analysts, and strategists who value insight over ornament. These charts distill intelligence into forms that provoke thought and prompt action.
From balanced scorecards to predictive models, our designs harmonize with Keynote`s strengths, leveraging smooth animations to unfold data layers progressively.
Gain an edge by presenting analytics that feel intuitive yet profound, tailored to contexts like mergers or market entries.
Visualize Victory: Select from our business-optimized charts and proceed.
Apartments for Rent Infographics: Visualizing Urban Opportunities
ID: #KC00385
$18.00
(395)
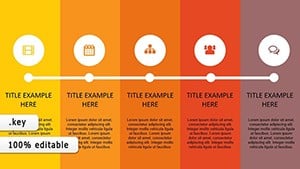
Dynamic Customer Service Skills Charts: Charting Paths to Excellence
ID: #KC00383
$17.00
(49)
Social Connections Keynote Charts: Visualize Networks with Impact
ID: #KC00376
$15.00
(939)
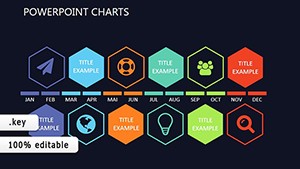
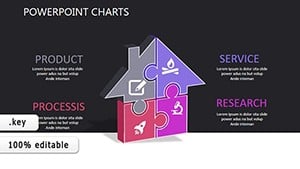
Illuminate Strategies in the Dark: Long-Term Plan Keynote Charts
ID: #KC00373
$18.00
(344)
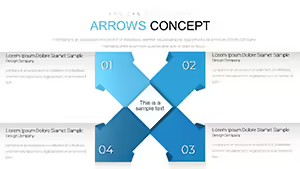
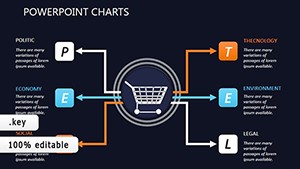
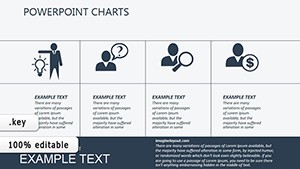
Search Decisions Keynote Charts Template: Elevate Your Presentations
ID: #KC00322
$16.00
(1007)
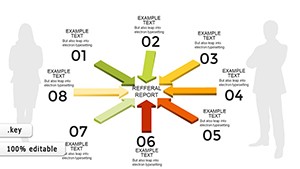
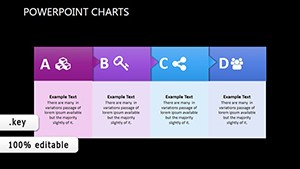
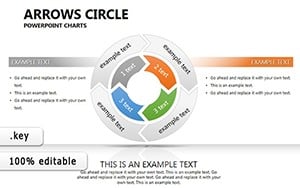
Arrows Circle Keynote Charts for Presentation
ID: #KC00263
$20.00
(483)
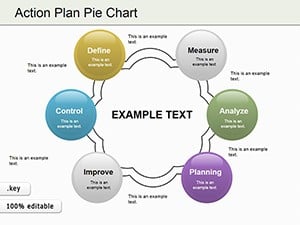
Action Plan Pie Charts Keynote Template
ID: #KC00187
$23.00
(953)
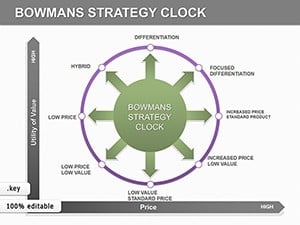
Bowman's Strategy Clock Keynote Charts: Time Your Market Moves
ID: #KC00185
$22.00
(602)
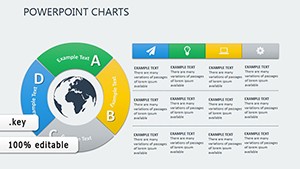
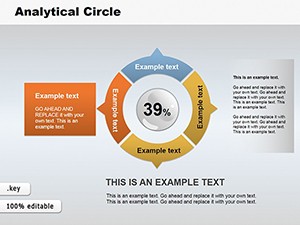
Analytic Circle Keynote Charts Template: Illuminate Data Stories
ID: #KC00135
$18.00
Elevating Business Analytics via Keynote Charts
Keynote charts in business contexts must convey urgency and accuracy. Our templates incorporate geospatial overlays for regional data and Monte Carlo simulations visualized as density plots, tools beyond vanilla capabilities.
They promote narrative integration, with chart captions that tie back to objectives seamlessly.
Performance Tracking: Real-time gauges.
Scenario Planning: Toggleable overlays.
Compliance: Audit-trail annotations.
Targeted Business Use Cases
Portfolio management deploys mosaic charts, tiling assets by risk-return profiles. Supply-demand equilibria shine in supply curve intersections, guiding pricing.
Sustainability dashboards aggregate carbon footprints in sunburst hierarchies, drilling to sources.
Strategic Forecasting
ARIMA trend extrapolations in smoothed lines, confidence bands for prudence.
Prioritize signal over noise: Crop to relevant ranges, using log scales judiciously for variances. Embed hyperlinks to sources for transparency.
Harmonize with deck tempo - slow builds for deliberation, rapid for highlights. Iterate via Keynote`s compare tool.
Pro Insight: Shadow charts for what-if contrasts.
Strategic Depth in Our Charts
Native charts miss bespoke metrics; ours supply cohort retention curves and churn funnels ready-coded.
Computational Aids: Scriptable data processors.
Visual Variety: 60+ archetypes.
Integration: iOS app syncing.
Analytics elevated to art.
Business Transformations Through Charts
A bank charted loan portfolios with chord diagrams, arcs linking defaults to sectors - refining underwriting. Marketers mapped sentiment via word clouds in radial bursts, refining campaigns.
Operations used queueing models in flow simulations, streamlining throughput. Charts as change agents.