Discover our professional stock Keynote charts templates designed to turn complex market data into clear visual stories. Ideal for traders analysts and educators these templates feature candlestick charts moving averages and volume histograms for precise insights.
Easily customize scales indicators and colors to match live feeds or historical data. Elevate your presentations with animated transitions and intuitive layouts that transform numbers into engaging narratives.
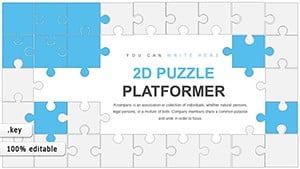
2D Puzzles Keynote Charts Template: Engage with Interactive Visuals
ID: #KC00817
$18.00
(529)
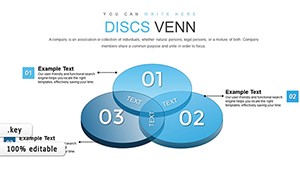
Transforming Complex Data with 3D Venn Keynote Charts
ID: #KC00811
$22.00
(739)
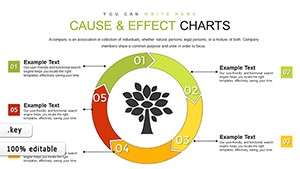
Cause and Effect Tree Keynote Charts
ID: #KC00800
$24.00
(747)
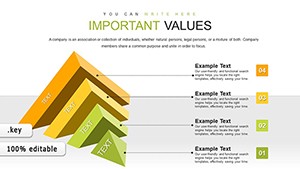
3D Horizontal Split Pyramid Keynote Charts: Dynamic Data Visualization
ID: #KC00748
$15.00
Enhance Your Presentations with Stock Keynote Charts
Our stock Keynote charts templates provide a professional edge over default charts by offering interactive and visually appealing designs. They simplify data analysis and storytelling for financial reports marketing plans and educational content.
Real-World Use Cases
Trading Briefs: Highlight intraday movements with heatmaps and momentum indicators.
Investor Education: Teach diversification and market trends using clear visuals.
Analyst Reports: Forecast earnings and visualize financial metrics with confidence intervals.
Portfolio Management: Track allocations with radar charts and flag rebalance triggers.
Benefits Compared to Default Templates
Interactive and animated visuals for engaging presentations.
Editable indicators and scales for precise data representation.
Time-saving layouts ready for immediate use.
Customizable color schemes and themes for professional polish.
Creative Tips and Best Practices
Use build animations to reveal data progressively.
Combine multiple chart types for comprehensive insights.
Link to external data sources for refreshable plots.
Experiment with dark-mode templates for presentations in low-light settings.
Explore our collection now and elevate your financial storytelling with ease.
Frequently Asked Questions
What chart types are included?
Candlesticks bars lines areas and specialized charts like Kagi or Renko for advanced analysis.
Do they support real-time data?
Yes via CSV imports or Yahoo Finance integrations for near-live updates.
Are mobile exports optimized?
Yes with aspect ratio adjustments for iPad and mobile Keynote viewing.
How to add technical indicators?
Pre-loaded formulas for MACD Stochastic RSI and more editable directly in Keynote inspector.
Can I theme for specific sectors?
Yes customizable overlays for tech energy or blue-chip stocks.