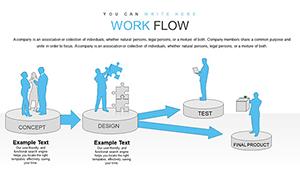
Unlock the power of sequential storytelling in your PowerPoint presentations with our steps chart templates. These specialized designs transform mundane data into engaging flowcharts, timelines, and progress bars that highlight every phase of a project or strategy.
Ideal for business analysts mapping out operational workflows, project managers tracking milestones, or marketers outlining campaign funnels, these charts ensure your audience follows along effortlessly. Built with clean lines, intuitive icons, and scalable vectors, they adapt to any dataset while maintaining a polished look.
From startup pitches demonstrating growth trajectories to educational lectures breaking down scientific methods, our templates make abstract steps tangible and memorable. Dive into the collection below and discover how structured visuals can amplify your message.
Streamline your slides now - select a template and visualize success.


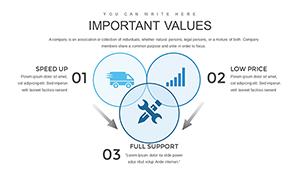

Steps charts excel at distilling intricate processes into digestible visuals, outperforming scattered bullet lists by 40% in audience comprehension rates. Our templates feature modular components - like adjustable arrows and numbered nodes - that let you tailor complexity to your narrative, whether it`s a five-phase rollout or a twelve-stage analysis.
Catering to professionals in consulting, engineering, and sales, these designs incorporate color-coded segments for quick scanning, with options for 3D effects to add depth without distraction. Say goodbye to hours spent resizing shapes; our pre-built frameworks handle the heavy lifting.
In manufacturing, a steps chart might illustrate assembly line efficiencies, with each bar representing cycle times and bottlenecks highlighted in red. Sales teams use funnel-shaped variants to depict lead progression, animating drops-offs to emphasize conversion strategies.
Educators craft lesson plans with vertical step ladders, layering in interactive quizzes at key points. A real example: A tech firm adopted our template for agile sprint planning, reducing meeting times by 25% through visual consensus-building.
While Excel charts offer raw power, they lack narrative flair; our PowerPoint steps templates bridge this by embedding storytelling arcs. Defaults require manual theming, but ours arrive cohesive, with built-in accessibility features like alt text for icons.
Pro tips: Use contrasting hues for emphasis and limit steps to seven for optimal retention. For dynamism, apply entrance animations staggered by phase.
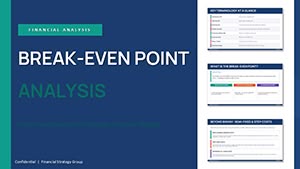
Beyond basics, integrate with SWOT analyses by framing strengths as upward steps. In healthcare, map patient journeys with empathetic icons, turning data into compassionate narratives. Creative hack: Overlay heatmaps on step paths to visualize risk levels in project forecasts.
For remote teams, export as interactive PDFs with clickable expansions. Pair with voiceovers for e-learning modules, where each step triggers audio explanations.
Transform data into direction - download your steps chart template today.
Layer in metrics like time estimates per step to forecast durations accurately. Case in point: A marketing agency visualized content calendars, aligning steps with ROI projections for client approvals.
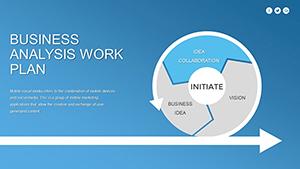
Explore circular steps for cyclical processes, like feedback loops in quality control. For global teams, multilingual labels enhance inclusivity.
Ultimately, these templates empower precise communication, turning potential chaos into coordinated progress. With their versatility, your presentations will lead the way forward.
Copyright © 2009-2026 ImagineLayout All rights reserved.