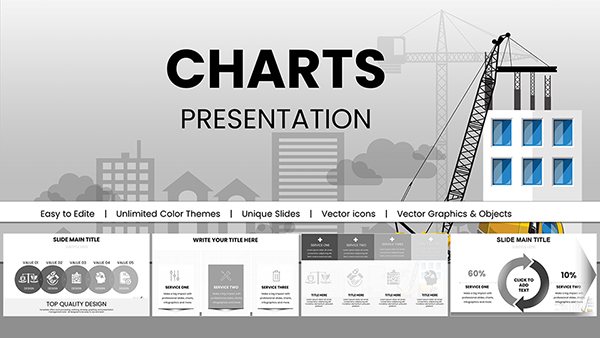
Bring your data to life with our square Keynote chart templates, crafted for users who demand precision and visual punch. These templates leverage square formats to create balanced, modern infographics that fit perfectly within Keynote`s ecosystem. Ideal for analysts, marketers, and educators presenting metrics, trends, or comparisons.
Square charts offer symmetry that enhances readability, making complex datasets accessible at a glance. Benefits range from instant editability to responsive scaling on any device. Picture quarterly sales figures in a crisp square grid - engaging without effort. Our collection targets those in high-stakes environments, delivering tools that save time and amplify impact.
Discover how these templates can refine your analytical narratives. Browse now and select the chart style that aligns with your goals.
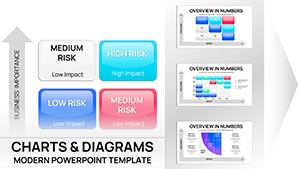


Square shapes in charts promote equilibrium, ideal for Keynote`s clean interface. They excel in displaying proportional data, like market shares or progress indicators, where balance underscores fairness and completeness. Business professionals use them for dashboard overviews, while teachers apply them to grade distributions.
Versus linear charts, squares contain information compactly, reducing slide clutter. Our templates feature animated builds that reveal data layers progressively, heightening suspense and comprehension.
Pro tip: Align squares with Keynote`s grid snap for pixel-perfect placement. Integrate subtle icons to denote categories, enhancing scannability.
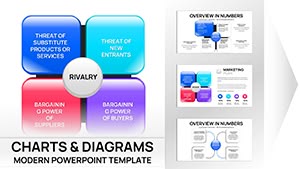
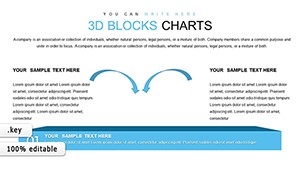
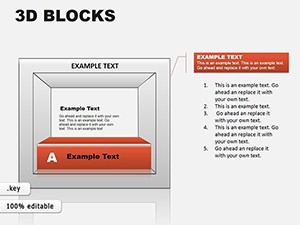
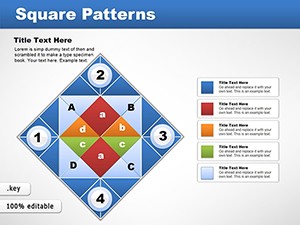
Square charts transform numbers into narratives. For a product launch, divide a square into performance zones - sales, feedback, growth. This modular approach outperforms traditional bars by focusing on relationships over sequences.
Our designs include gradient fills for depth and hover effects for digital delivery. Customize axes and labels effortlessly, ensuring accessibility with high-contrast options.
These steps yield professional results in under 30 minutes, freeing you for content refinement.
A healthcare team visualized patient outcomes using square heatmaps, improving decision-making clarity. In retail, square funnel charts mapped customer journeys, revealing drop-off points vividly.
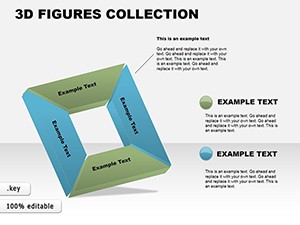
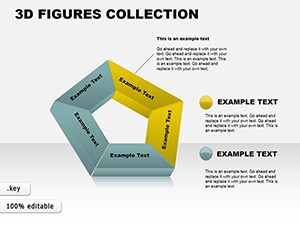
Creative twist: Use interlocking squares for interconnected processes, like supply chain flows. This visual metaphor resonates in strategy sessions.
Keynote`s vector support ensures squares resize flawlessly, ideal for print or web exports.
Combat information fatigue by limiting squares to 4-6 per slide. Opt for monochromatic schemes for focus, or vibrant pops for emphasis. Test with audience proxies to gauge effectiveness.
Unlike Excel imports, our native Keynote files avoid formatting glitches, streamlining revisions.
Begin by choosing a template suited to your data type - discrete or continuous. Layer text annotations for context, and export as interactive PDFs for sharing.
Advanced users: Script custom animations via Keynote`s inspector for tailored pacing.
Enhance your toolkit today - download a square chart template and watch your presentations gain traction.
Copyright © 2009-2026 ImagineLayout All rights reserved.