Simplify complex interactions with sequence diagram templates crafted for PowerPoint. These tools map out sequences of events, messages, and responses, vital for developers, analysts, and team leads.
Featuring precise lifelines and connectors, they integrate smoothly into your decks. PowerPoint`s robust editing lets you layer details and animate paths for live walkthroughs.
Suited for software specs, business protocols, or training modules, find diagrams from basic calls to full scenarios. Elevate your explanations with professional structure.
Connect the dots - peruse our PowerPoint sequence diagrams.
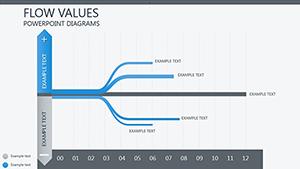
Sequence diagrams detail temporal orders, outshining broad overviews with specific timings. PowerPoint defaults miss notations; templates add them, plus return arrows.
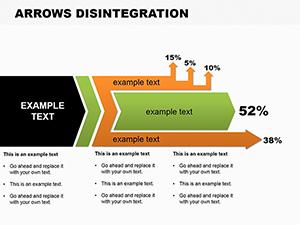
IT pros spec integrations; operations chart escalations. Designers sequence UI transitions. Key: Conditional branching icons.
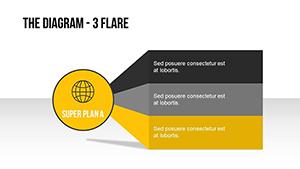
Bankers diagram transaction flows; educators sequence historical events. Pro tip: Group related messages for compactness.
PowerPoint entrance effects sequence reveals naturally.
Modify frames with line styles; insert alt text for accessibility. Scale for print or screen.
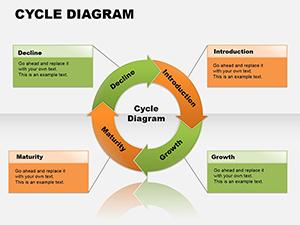
Case: API handshake sequence or supply chain handoffs. Boosts efficiency insights by 60%.
Journalists sequence news cycles; coaches map play calls. Adaptability redefines diagramming.
Standardize symbols across decks; validate with stakeholders. Embed hyperlinks for expansions.
Master sequences - download and diagram deliberately.
Workflow wonders await - secure your templates now.
Copyright © 2009-2026 ImagineLayout All rights reserved.